


XRP (XRPUSD) Volatility Intensified on Aug 20: What You Should Know
XRP (XRPUSD) is up 1.10% at Aug 20 03:00(ET), now at $1.1112, with a 7-day up of 10.15%.
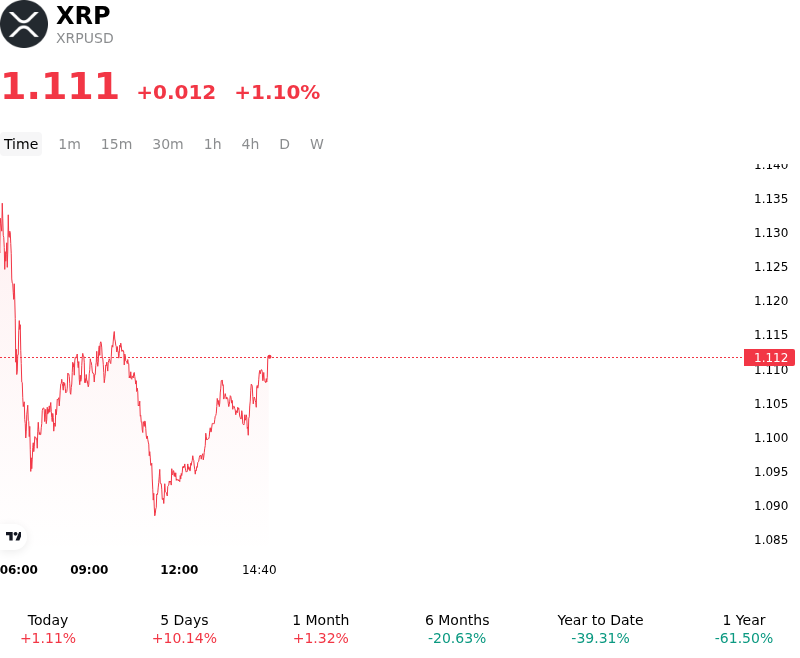
What is driving XRP (XRPUSD)’s stock price up today?
The advance in XRPUSD was primarily driven by a broader improvement in global macro liquidity conditions alongside escalating regulatory momentum in the United States. A decision by the U.S. Treasury to significantly expand its debt buyback operations injected fresh liquidity into money markets, placing downward pressure on yields and bolstering overall risk appetite across digital assets. This constructive macroeconomic backdrop was further reinforced by high-level policy developments in Washington, where a White House digital asset summit brought together regulatory leadership and industry executives to advance federal market structure legislation, boosting long-term compliance expectations and institutional sentiment.
Institutional participation offered crucial support as spot XRP exchange-traded funds documented a notable uptick in net inflows. Following sessions of stagnant capital movement, the resurgence in net creation across U.S. spot products pointed to resilient institutional demand, helping defend key technical support levels. In tandem, ongoing developments within the broader ecosystem—highlighted by new commercial banking arrangements utilizing blockchain payment rails for cross-border remittances—fortified the broader utility narrative and reinforced expectations for corporate cross-border payment adoption.
Market mechanics and derivatives positioning further catalyzed the upside move. Derivatives market data indicated that leverage had grown increasingly short-biased during recent range-bound trading, leaving short sellers vulnerable to a liquidity-driven squeeze as spot market bids picked up. On-chain analytics mirrored this tightening supply dynamic, displaying an acceleration in large-value transactions and ongoing supply migration away from centralized exchange order books. Despite the positive intraday trajectory, institutional desks remain focused on broader macro liquidity trends, upcoming legislative milestones in Congress, and scheduled supply releases as key risk factors moving forward.
Technical Analysis of XRP (XRPUSD)
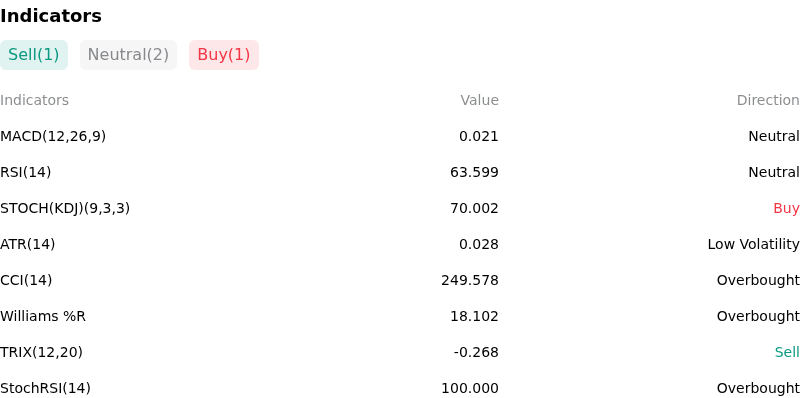
Technically, XRP (XRPUSD) shows a MACD (12,26,9) value of 0.021, indicating a neutral signal. The RSI at 63.599 suggests neutral condition and the Williams %R at 18.102 suggests overbought condition. Please monitor closely.
More details about XRP (XRPUSD)
Recent Events and Risks:
- Leveraged Long Liquidation Exposure: XRP is testing the critical $1.00 psychological support level following a technical daily death cross, while derivatives exchanges hold over $1.5 billion in open leveraged long positions that risk triggering aggressive liquidation cascades if key support breaks.
- Deteriorating Institutional ETF Demand: Weekly spot XRP ETF inflows experienced a severe decline of over 90% to roughly $1 million, signaling a rapid pullback in institutional buying power and leaving market depth vulnerable to sellside pressure.
- Stalled Legislative Catalysts: The failure to advance the CLARITY Act before the August recess and low prediction market odds for near-term legislative approval have removed a primary regulatory catalyst previously priced into XRP valuations.
- Cross-Chain Bridge Security Incident: A recent security exploit affecting a bridge between the TX Chain and the XRP Ledger resulted in stolen tokens and a bridge suspension, damaging network sentiment and contributing to temporary intraday drops below $1.00.
Recommended Articles


