


Dell Technologies Inc Stock (DELL) Moved Down by 6.08% on Aug 19: What Signal Does It Send?
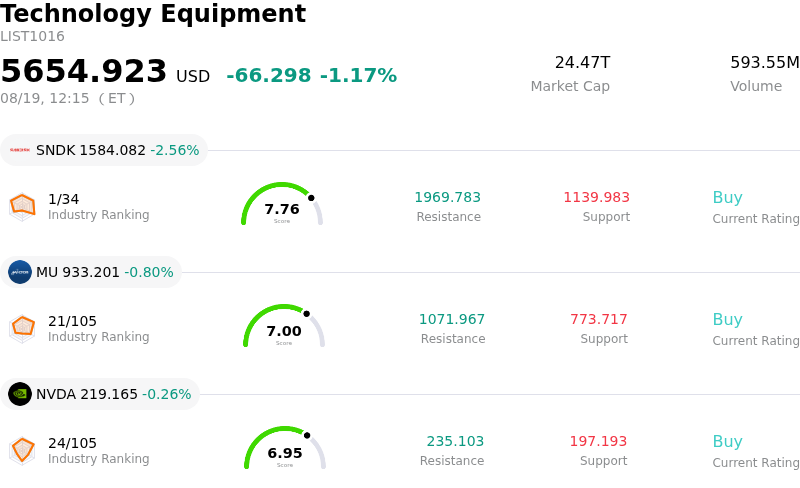
Dell Technologies Inc (DELL) moved down by 6.08%. The Technology Equipment sector is down by 1.17%. The company underperformed the industry. Top 3 stocks by turnover in the sector: SanDisk Corporation (SNDK) down 2.56%; Micron Technology Inc (MU) down 0.80%; NVIDIA Corp (NVDA) down 0.26%.
What is driving Dell Technologies Inc (DELL)’s stock price down today?
Dell Technologies experienced noticeable downward pressure and intraday volatility as market participants engaged in profit-taking following a powerful multi-month surge. The enterprise hardware giant recently hit record high territory, driven by accelerating enterprise demand for its AI-optimized servers, expanding AI infrastructure backlog, and high-profile technology supply partnerships. However, with the stock trading at elevated valuation multiples following an exceptional year-to-date rally, market sentiment shifted toward caution, prompting profit realization across the enterprise technology sector.
Additional pressure stemmed from growing investor scrutiny surrounding reported insider share sales over recent quarters, which raised questions among traders regarding immediate upside potential at current price levels. Option market activity also signaled heightened short-term nervousness, characterized by an influx of put volume and increased implied volatility as institutional investors sought downside hedging ahead of the company's upcoming earnings release. While several Wall Street research firms recently reiterated bullish long-term ratings and raised price targets based on Dell's expanding storage business and strong competitive positioning in enterprise AI, short-term price action reflected risk reduction and capital preservation.
Broader portfolio rebalancing across the tech sector further amplified the pullback. Investors across the artificial intelligence infrastructure landscape are reassessing short-term growth expectations, margin durability, and supply chain timelines prior to catalyst events. Although Dell's fundamental outlook remains supported by expanding data center buildouts and strong multi-cloud enterprise demand, its share price is undergoing a temporary consolidation driven by valuation discipline, pre-earnings hedging, and typical profit-taking after substantial historical gains.
Technical Analysis of Dell Technologies Inc (DELL)
Technically, Dell Technologies Inc (DELL) shows a MACD (12,26,9) value of 6.397, indicating a buy signal. The RSI at 56.046 suggests neutral condition and the Williams %R at 34.618 suggests buy condition. Please monitor closely.
Media Coverage of Dell Technologies Inc (DELL)
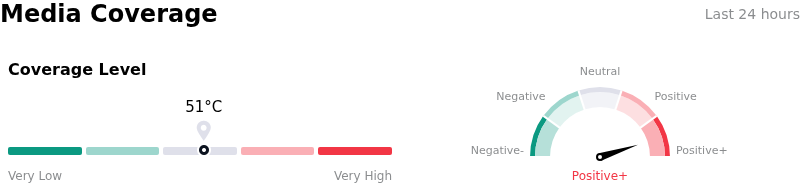
In terms of media coverage, Dell Technologies Inc (DELL) shows a coverage score of 51, indicating a moderate level of media attention. The overall market sentiment index is currently in extremely bullish zone.
Fundamental Analysis of Dell Technologies Inc (DELL)
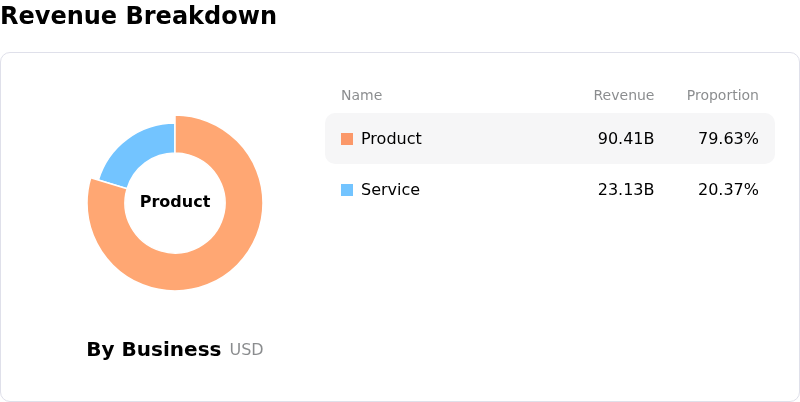
Dell Technologies Inc (DELL) is in the Technology Equipment industry. Its latest annual revenue is $113.54B, ranking 2 in the industry. The net profit is $5.94B, ranking 4 in the industry. Company Profile
Over the past month, multiple analysts have rated the company as Buy, with an average price target of $497.58, a high of $700.00, and a low of $360.00.
More details about Dell Technologies Inc (DELL)
Company Specific Risks:
- Pre-Earnings Volatility & Derivatives Skew: Options market activity over the last 24 to 72 hours shows a elevated put-to-call ratio of 1.56 and a sharp rise in implied volatility, indicating institutional traders are aggressively buying downside protection and bracing for potential sharp intraday moves ahead of the upcoming earnings release.
- AI Product Mix & Gross Margin Compression: Analysts express concern over underlying gross margin squeeze, as the rapid top-line shift toward lower-margin AI-optimized hardware combined with high component and memory costs threatens profitability metrics despite strong headline revenue growth.
- Stretched Valuation & Unforgiving Expectations: Following an extraordinary year-to-date rally pushing forward valuation multiples above 34x P/E, the stock trades at a steep premium, leaving zero margin for error and rendering shares hypersensitive to profit-taking or minor execution shortfalls.
- Insider Liquidations & Shareholder Divestment: SEC filings highlight ongoing large-scale selling and conversion of Class B to Class C shares by key insiders and major private equity stakeholders, creating institutional supply overhead near record valuation levels.
Recommended Articles


