


XRP (XRPUSD) Is down 1.09% on Aug 17: Here Is Why
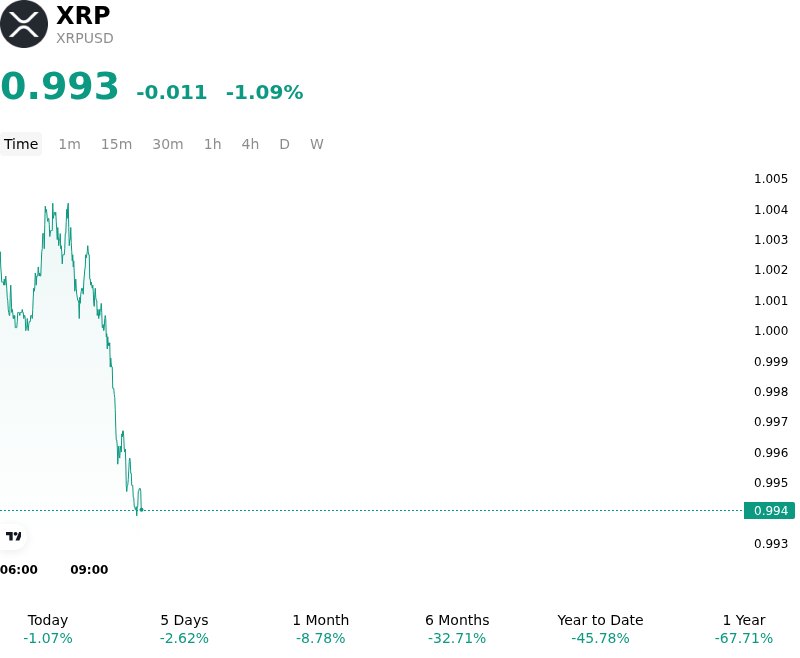
XRP (XRPUSD) is down 1.09% at Aug 17 22:45(ET), now at $0.9926, with a 7-day down of 2.44%.
What is driving XRP (XRPUSD)’s stock price down today?
XRP experienced downward pressure as derivatives market positioning tilted toward short sellers while spot buy-side conviction remained muted. On derivatives venues, open interest expanded to multi-month highs, yet perpetual cumulative volume delta turned sharply negative, indicating that the build-up in contract exposure was driven predominantly by short initiation rather than long accumulation. This aggressive short positioning weighed on spot order books, pushing trading activity to test critical psychological support levels.
Institutional capital flows through spot XRP investment products provided insufficient buy-side absorption to counter the futures market pressure. Demand via spot exchange-traded products registered only modest net inflows, reflecting tactical institutional caution rather than sustained portfolio allocation. Without robust primary market creation or sizable spot ETF inflows to absorb secondary market supply, spot liquidity thinned, making price action particularly sensitive to short-driven hedging and localized spot distribution.
The softness aligned with broader digital asset market consolidation, as benchmark assets traded within tight ranges ahead of upcoming Federal Reserve policy communications and macroeconomic updates. Although on-chain metric trends and enterprise infrastructure updates—such as expanding stablecoin issuance on the XRP Ledger—demonstrate long-term ecosystem development, short-term valuation remains tethered to derivatives positioning and spot capital flows. Investors and market makers continue to monitor whether spot buying volume recovers to absorb elevated short exposure, as persistent selling could test lower liquidity thresholds while a reversal in order flow risks triggering a short squeeze.
Technical Analysis of XRP (XRPUSD)
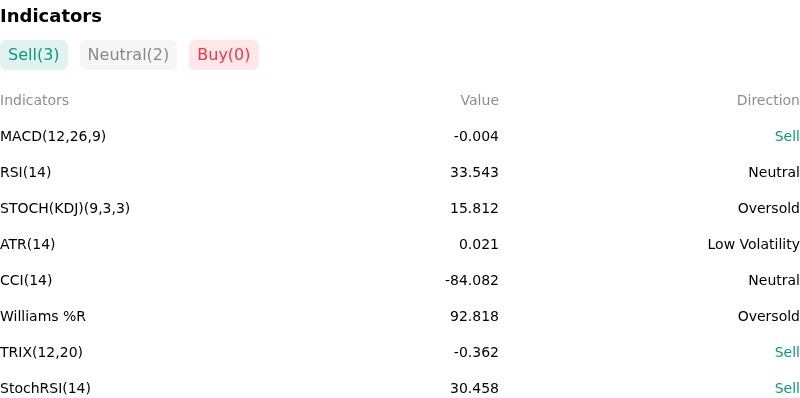
Technically, XRP (XRPUSD) shows a MACD (12,26,9) value of -0.004, indicating a sell signal. The RSI at 33.543 suggests neutral condition and the Williams %R at 92.818 suggests oversold condition. Please monitor closely.
More details about XRP (XRPUSD)
Recent Events and Risks:
- Legislative and Regulatory Stagnation: Legislative momentum for federal digital asset frameworks has faltered as institutional analysts lowered the 2026 passage probability of the U.S. CLARITY Act to just 10%, while the SEC postponed its mid-August rulemaking meeting regarding tokenized asset exemptions, stalling statutory regulatory catalysts for XRP.
- Institutional Capital Inflow Deceleration: Weekly net flows into spot XRP exchange-traded products suffered a steep deceleration—dropping over 90% week-over-week—reflecting a defensive posture from institutional investors and muted spot buying demand needed to sustain upward momentum.
- Declining XRPL On-Chain Engagement and Overhead Supply Resistance: Active XRP Ledger (XRPL) wallet accounts have dropped by over 50% year-to-date alongside negative Chaikin Money Flow indicators, leaving the asset struggling to absorb massive overhead sell-side liquidity from holders attempting to exit at break-even price zones.
- Derivatives Liquidation Pressure and Thinned Session Liquidity: Leveraged long position clusters concentrated near the $0.98 to $1.00 key support zone face heightened liquidation cascade risk, which is amplified by thinning order book depth during North American and European trading sessions.
Recommended Articles


