


Crypto Market Overview: Bitcoin rebounds while Polygon, Zcash lead gains
- Bitcoin sustains above $64,000 on Tuesday, following over 2% gains the previous day.
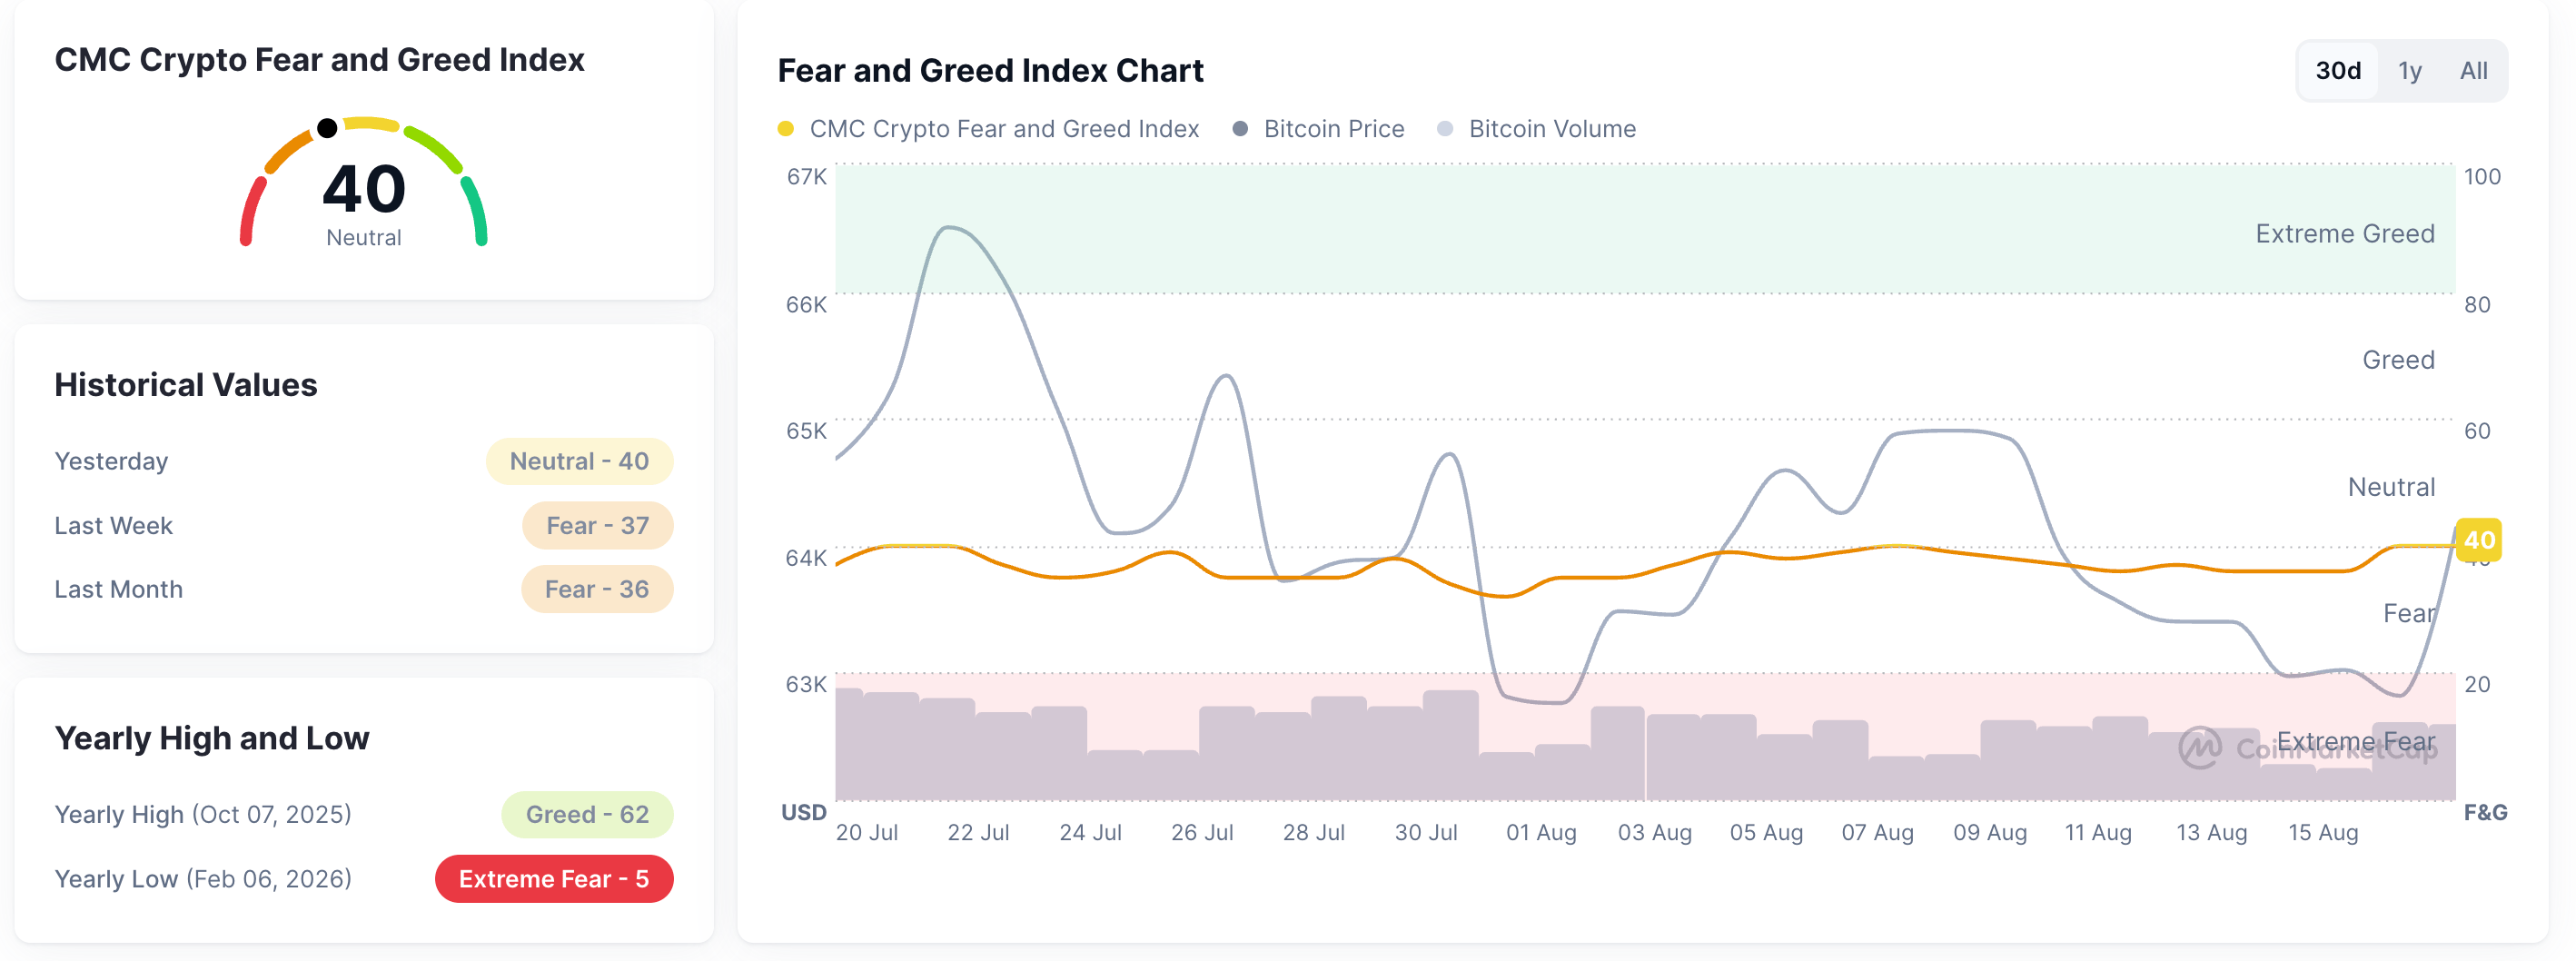
- Fear and Greed Index rises to 40, indicating a mild improvement in crypto market sentiment.
- Polygon and Zcash have seen leading gains over the last 24 hours, emerging as top performers.
The broader cryptocurrency market shows a mild easing in the persistent risk-off sentiment, with Bitcoin (BTC) rising above $64,000. Polygon (POL) and Zcash (ZEC) have emerged as top performers over the last 24 hours, with bulls eyeing further gains.
CoinMarketCap’s Fear and Greed Index at 40 on Tuesday suggests a mild recovery from risk-averse conditions.
Technical outlook: Will Bitcoin sustain its recovery?
Bitcoin trades around $64,200 at press time on Tuesday, edging lower after a 2% rise the previous day. BTC remains capped below the 50-day Exponential Moving Average (EMA) at $64,349 and well under the 200-day EMA near $72,860.68.
Price holds above the rising support trendline, whose break price sits at $62,702.76, and above the 23.6% Fibonacci retracement at $63,711, measured over the $82,850 to $57,800 downswing. Still, the inability to reclaim the nearby 50-day EMA keeps upside attempts vulnerable.
The Relative Strength Index (RSI) at 51 is broadly neutral, while the Moving Average Convergence Divergence (MACD) hovers slightly negative, hinting at fading bullish momentum.
On the topside, immediate resistance is defined by the 50-day EMA at $64,349, followed by the 50% retracement around $70,325.
On the downside, initial support is seen at the 23.6% Fibonacci retracement at $63,711, with the rising trendline break level at $62,702 underpinning the broader structure.
Technical outlook: Could Polygon and Zcash sustain upside momentum?
Polygon trades near $0.0794, holding above the 50-day EMA at $0.0769 and the reclaimed downward trendline break level at $0.0769, which together reinforce a constructive near-term bias. Still, the altcoin remains well below the 200-day EMA at $0.0964, leaving the broader trend capped.
Positive momentum is evident on the daily chart, as the RSI hovers around 61 and the MACD line remains above its signal line, suggesting that buyers still have the upper hand in the short term.
The immediate resistance for POL aligns with the July 14 high at $0.0854, guarding the upside toward the June 3 high at $0.0958, which is close to the 200-day EMA at $0.0964.
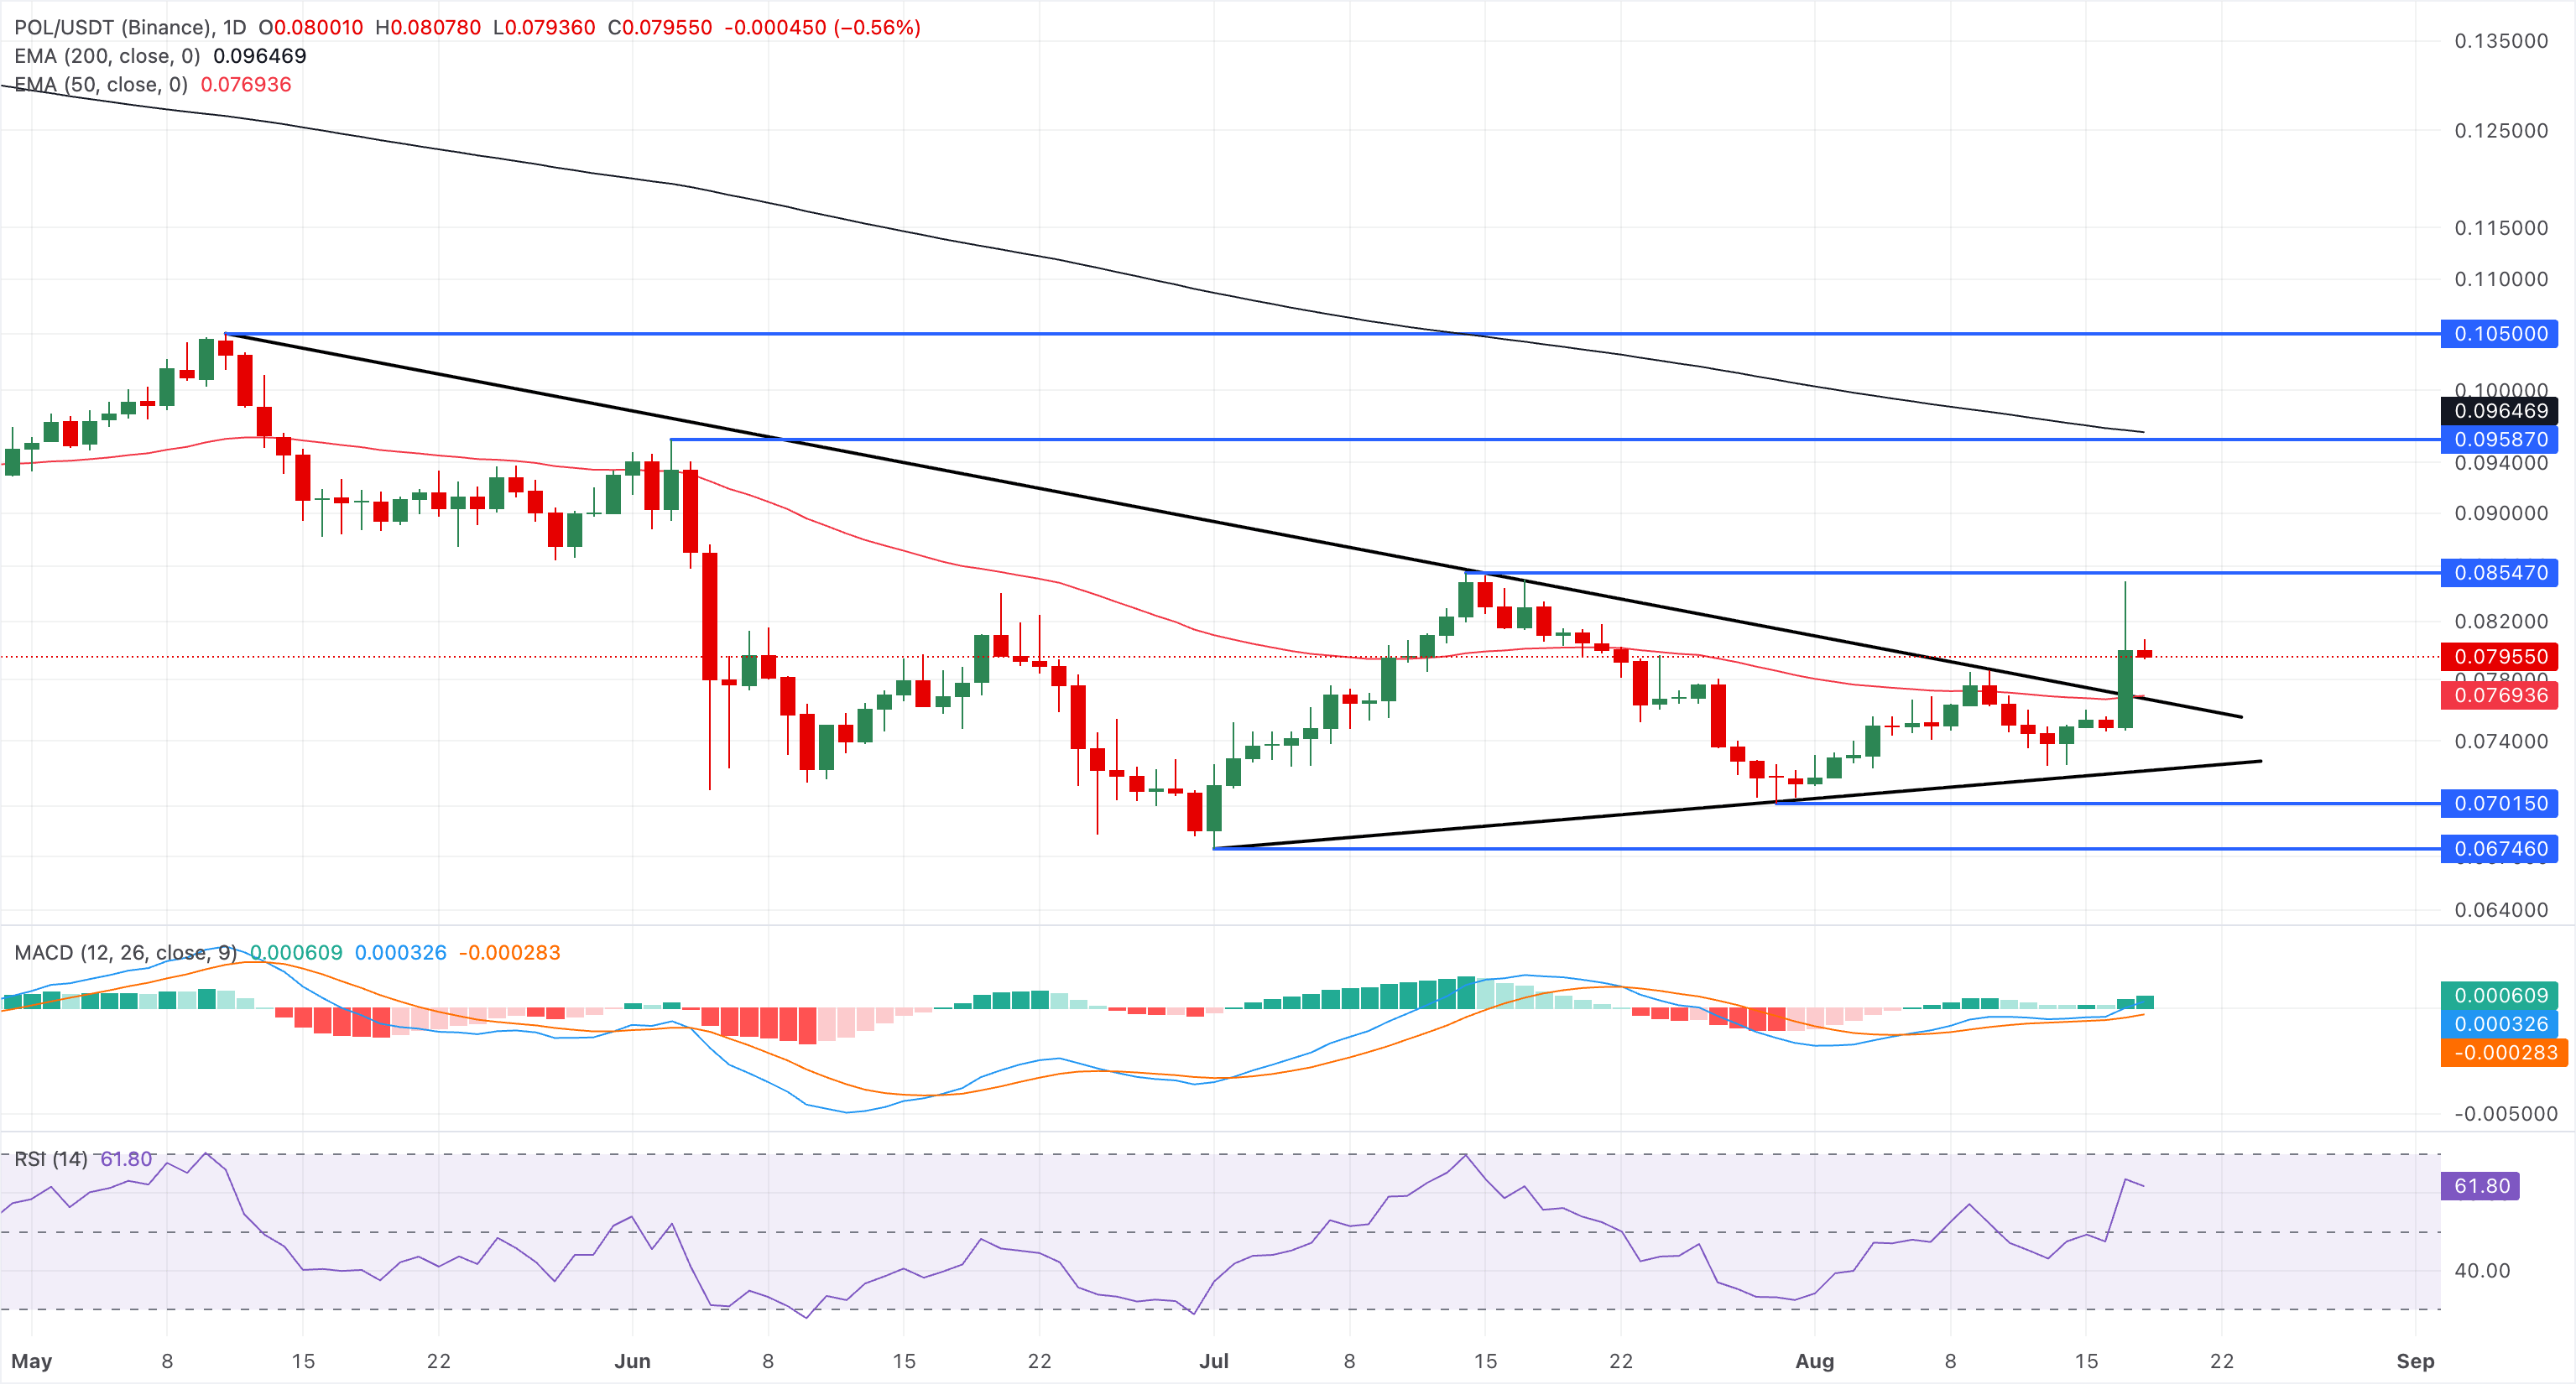
On the downside, immediate support is seen at the firm demand zone emerging around the $0.0769 cluster defined by the 50-day EMA and the former descending trendline.
Zcash sustains above $500 on Tuesday, holding its 5% gains from the previous day. The privacy coin retains a constructive bullish tone as it holds above both the 50-day EMA at $491 and the 200-day EMA at $431.
Price is also trading above the 50% Fibonacci retracement at $470, measured from the downswing from $690 to $250, while it is currently capped by the 78.6% retracement at $555 and an overhead trendline near $532.
Momentum shows a mild upside bias, with the MACD rising slightly above the signal line and the RSI hovering around 55, suggesting steady but not overextended buying pressure.
On the topside, immediate resistance is located at the overhead trendline around $532. A daily close above this zone would open the way toward the 78.6% retracement at $555 and ultimately the cycle high reference near $690.
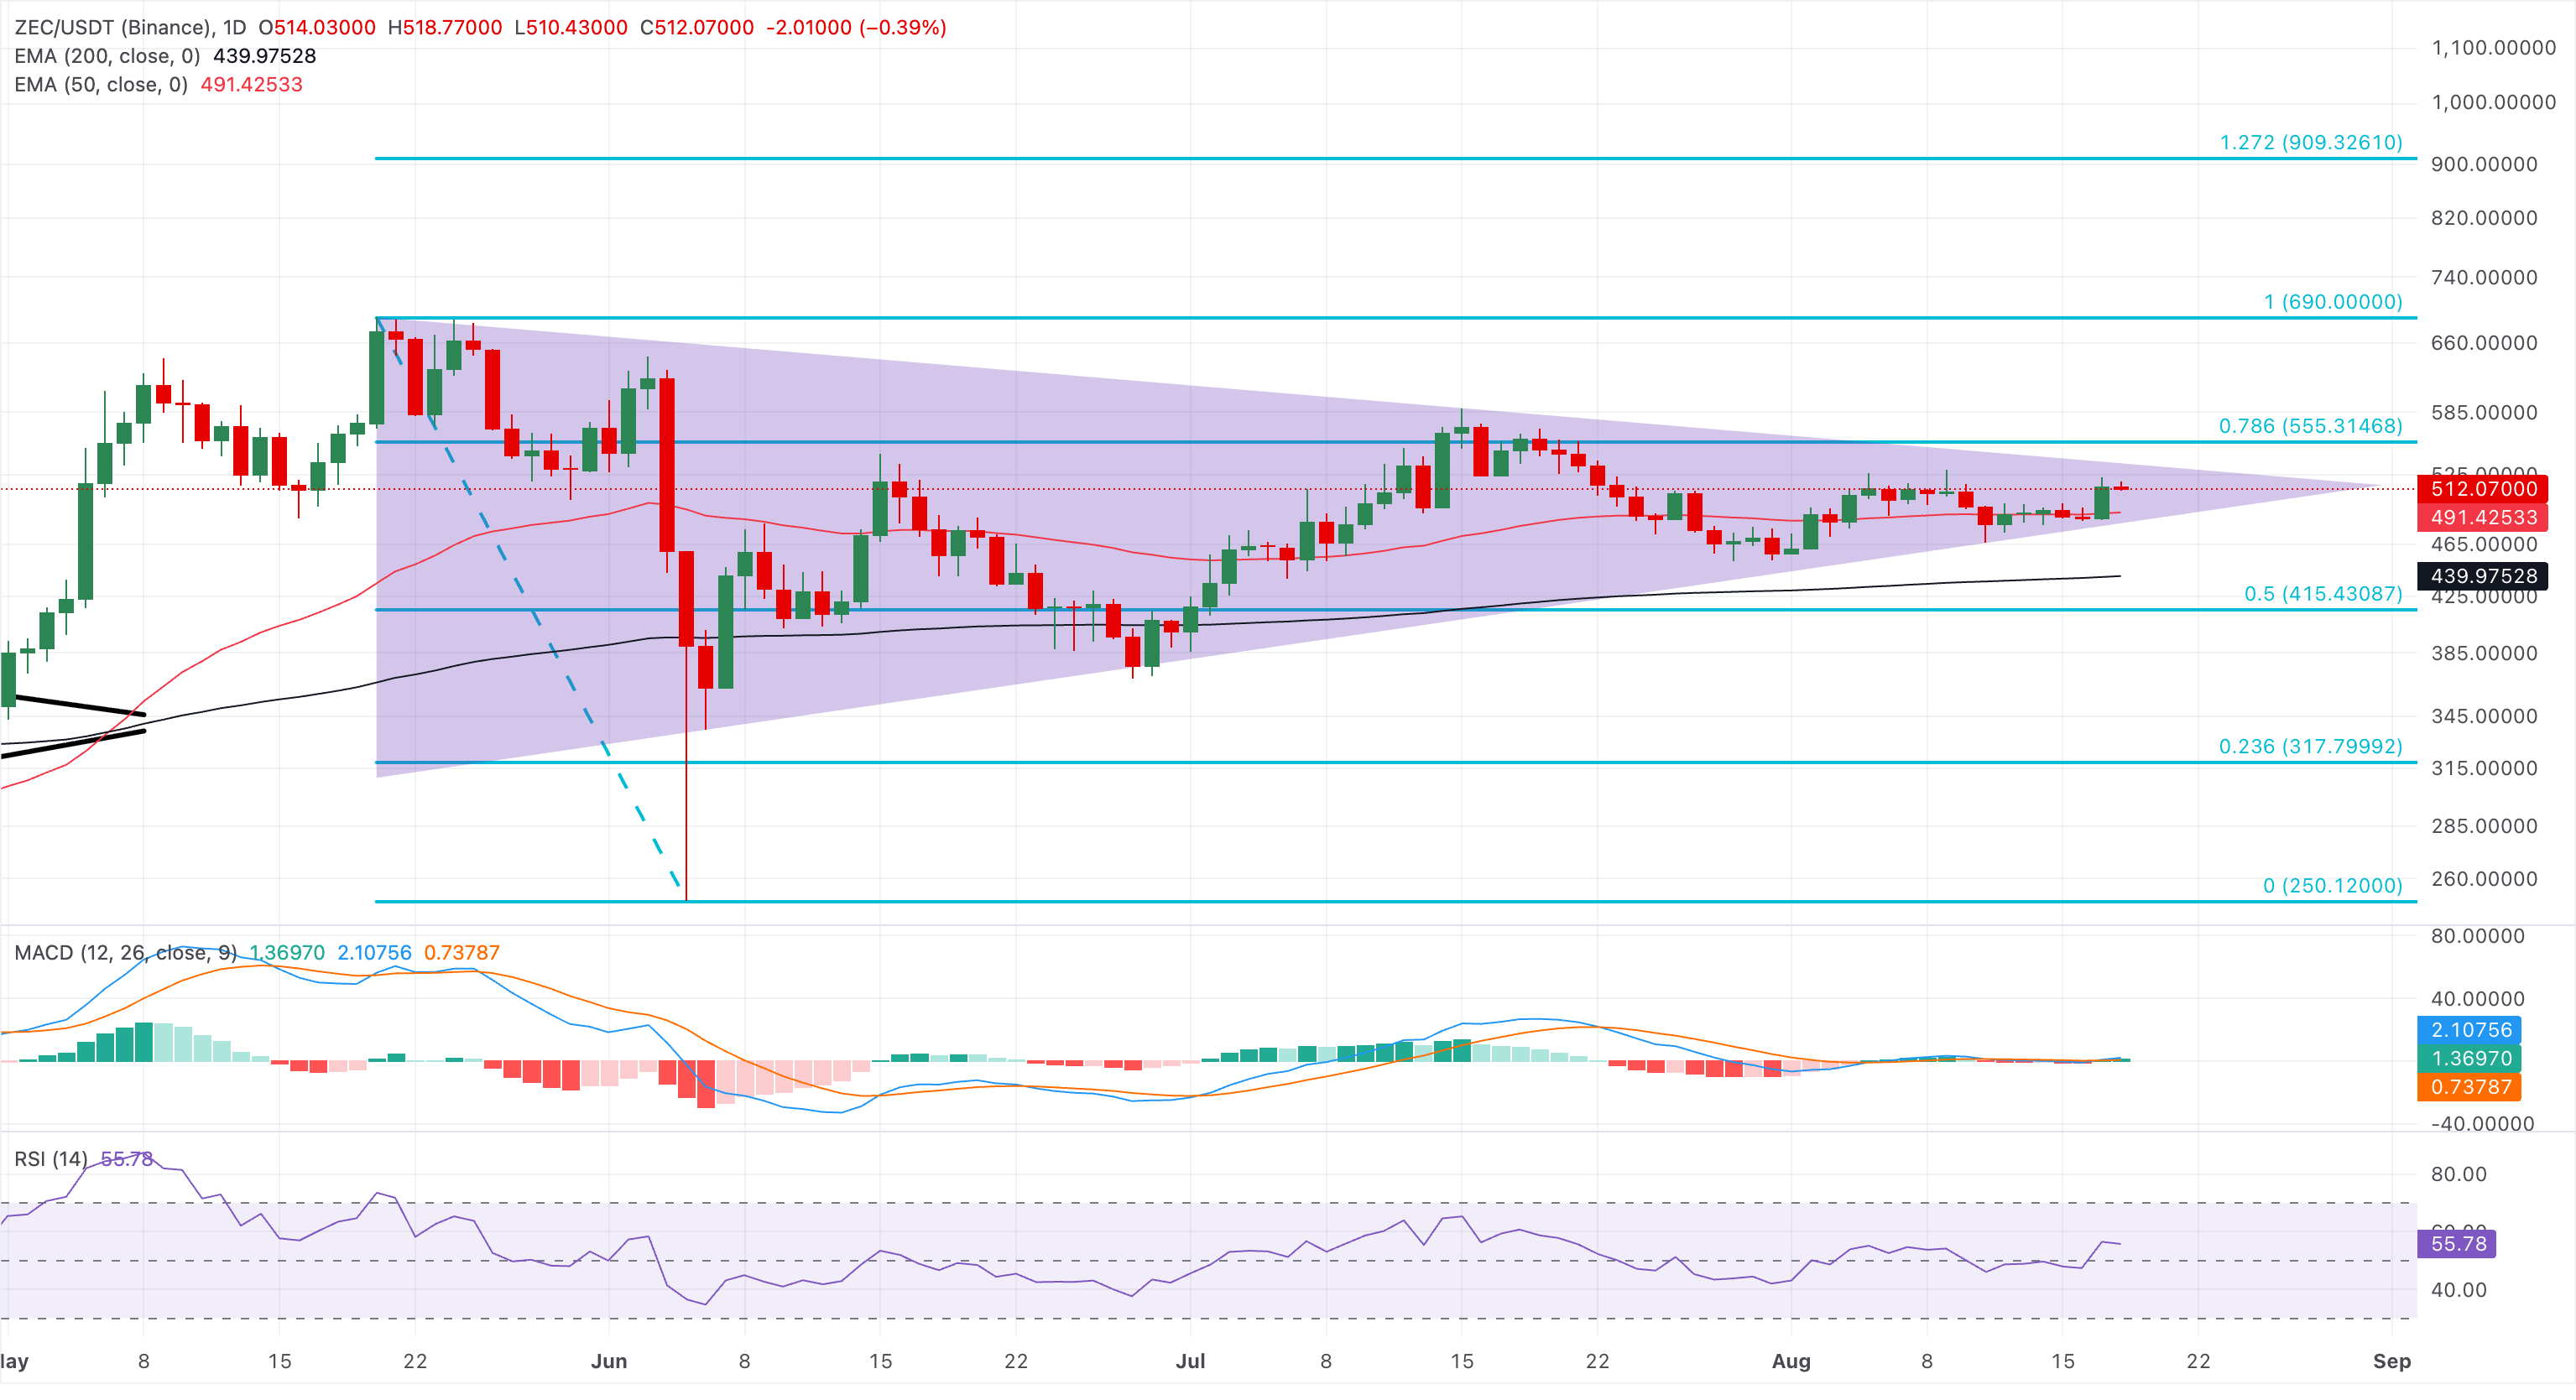
On the downside, initial support is provided by the 50-day EMA at $491, ahead of the 50% retracement at $470. A deeper pullback would expose the 200-day EMA at $431.
(The technical analysis of this story was written with the help of an AI tool. Know more.)
Recommended Articles


