


Ethereum (ETHUSD) Is up 1.16% on Aug 16: What Are the Risk Factors?
Ethereum (ETHUSD) is up 1.16% at Aug 16 22:55(ET), now at $1901.22, with a 7-day up of 1.28%.
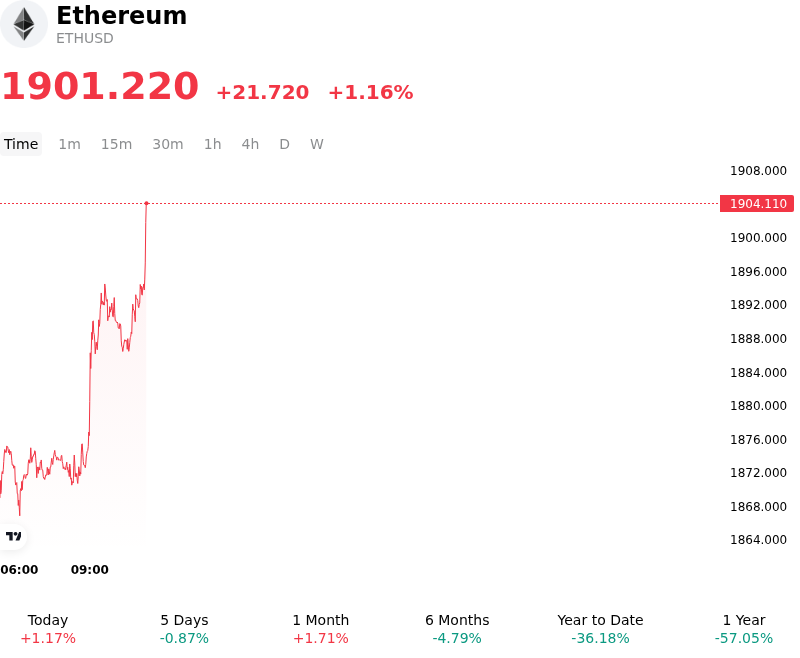
What is driving Ethereum (ETHUSD)’s stock price up today?
Capital flowed into Ethereum as derivatives positioning and structural supply constraints fueled positive intraday price action. In an environment characterized by lower weekend spot volume, futures positioning showed a notable tilt toward long exposure across major trading venues. As spot prices edged upward through key intraday resistance levels, localized short-covering activity sparked brief volatility spikes, amplifying upward momentum. The underlying supply dynamics supported this movement, as roughly a third of circulating ETH remains locked in network staking contracts, restricting immediate exchange-side liquidity and heightening price responsiveness to incremental buying pressure.
Institutional sentiment around Ethereum received a constructive boost from recent product filings aimed at expanding capital access and yield generation. Strategic moves by major asset managers to incorporate staking mechanics into spot Ethereum exchange-traded funds have reinvigorated long-term narrative prospects, offering institutional market participants a potential path toward regulated yield exposure. Furthermore, ongoing developer progress regarding network execution and state-growth management continues to reassure investors of Ethereum's long-term scaling roadmap, providing a fundamental anchor against broader market stagnation.
From a macroeconomic perspective, digital assets operated within a context of recalibrating interest rate expectations ahead of upcoming Federal Reserve communications. Softer macroeconomic data points have diminished fears of further monetary policy tightening, stabilizing broader risk appetite despite lingering geopolitical uncertainties. While market participants continue to monitor spot ETF flows and derivative leverage ratios for signs of overextension, the combination of constrained exchange liquidity, constructive institutional filings, and resilient ecosystem fundamentals drove capital back into Ethereum.
Technical Analysis of Ethereum (ETHUSD)
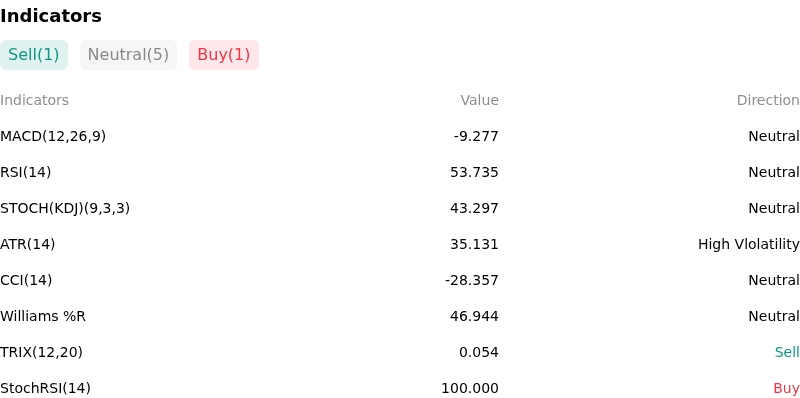
Technically, Ethereum (ETHUSD) shows a MACD (12,26,9) value of -9.277, indicating a neutral signal. The RSI at 53.735 suggests neutral condition and the Williams %R at 46.944 suggests neutral condition. Please monitor closely.
More details about Ethereum (ETHUSD)
Recent Events and Risks:
- Regulatory Uncertainty and SEC Delays: Ongoing regulatory delays surrounding proposed digital asset frameworks have constrained institutional risk appetite, causing major trading desks to maintain defensive positioning and curtail fresh spot allocations.
- Technical Rejections and Overhead Resistance: Repeated rejections at the $1,900–$1,920 resistance region and a breakdown below short-term trendlines have left ETHUSD compressed near $1,870, escalating technical pressure toward key support at $1,800–$1,850.
- Derivatives Leverage and Liquidation Cascades: A heavy concentration of leveraged long positions in perpetual futures markets clustered near $1,840–$1,860 creates vulnerability to forced long liquidations and intraday downward volatility if prices weaken further.
- Slowing Institutional Demand and ETF Outflows: Broader crypto ETF outflows and decisions by major treasury accumulators to temper their weekly spot purchasing pace have diminished spot order book liquidity, leaving the market prone to overhead selling pressure.
Recommended Articles


