


Natural Gas - Futures (NATGAS-F) Drops on Aug 16: Key Factors to Watch
Natural Gas - Futures (NATGAS-F) is down 2.03% at Aug 16 21:35(ET), now at $2.652, with a 7-day down of 4.26%.
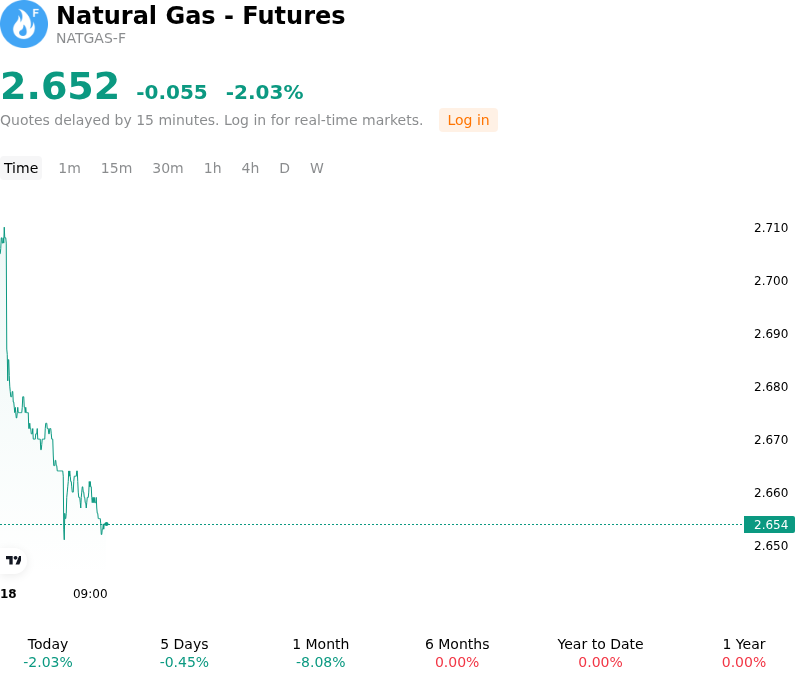
What is driving Natural Gas - Futures (NATGAS-F)’s stock price down today?
U.S. natural gas futures experienced downside pressure as robust domestic production levels and elevated inventory buffers continue to outpace total demand expectations. Strong output across major shale basins, particularly associated gas volumes from the Permian Basin alongside stable drilling activity in the Haynesville, has maintained an oversupplied physical market balance. At the same time, recent weekly storage injection reports confirmed steady additions to underground working gas reserves, keeping total inventories comfortably above historical five-year averages and reinforcing market expectations of an ample supply cushion heading into the autumn shoulder season.
Demand-side fundamentals provided little momentum to offset the expanding supply base. Although seasonal summer heat sustained baseline power-sector burn for cooling across parts of the country, overall demand gains were capped by reduced feedgas intake at domestic liquefied natural gas export terminals undergoing seasonal maintenance and operational throttling. The temporary moderation in LNG export flows diverted additional supply back into domestic distribution pipelines, further loosening prompt-month market balances and dampening bullish momentum.
From a broader perspective, the price action reflects a re-pricing of market expectations as funds and institutional traders adjust positions to reflect structural oversupply. With storage levels on track to enter the winter heating season at high capacity, prompt contracts remain constrained by a lack of immediate storage scarcity. Institutional market participants continue to monitor potential late-season heatwaves that could temporarily lift power-sector demand, potential tropical weather disruptions along the Gulf Coast export corridor, and any disciplined curtailments from natural gas producers seeking to defend price floors.
Technical Analysis of Natural Gas - Futures (NATGAS-F)
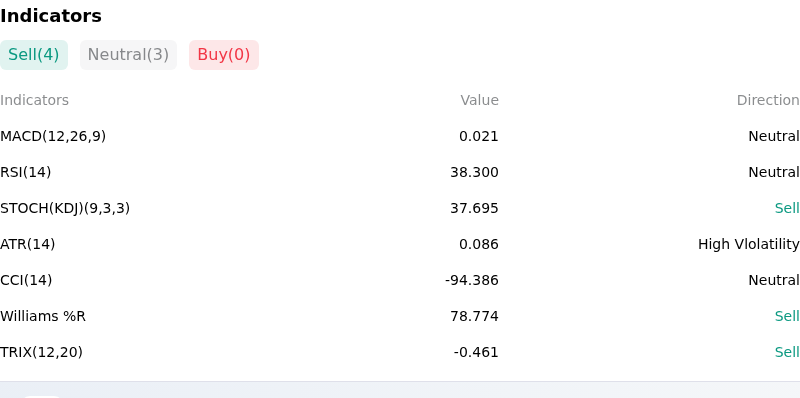
Technically, Natural Gas - Futures (NATGAS-F) shows a MACD (12,26,9) value of 0.021, indicating a neutral signal. The RSI at 38.300 suggests neutral condition and the Williams %R at 78.774 suggests sell condition. Please monitor closely.
More details about Natural Gas - Futures (NATGAS-F)
Recent Events and Risks:
- Expanding Storage Surplus and Bearish Injections: The EIA reported a larger-than-expected U.S. natural gas storage injection of 36 Bcf for the week ended August 7, beating consensus expectations of 30–32 Bcf and widening the seasonal storage surplus to 198 Bcf (6.7%) above the five-year average. EIA projections that inventories will hit a 10-year high of 3,985 Bcf by late October continue to exert strong overhead price pressure.
- Surging Lower-48 Production and Pipeline Debottlenecking: Lower-48 dry natural gas production rose to 114.4 Bcf per day alongside an increase in active rigs, outpacing demand despite extreme summer heat. Additionally, the imminent full operation of Energy Transfer's 1.5 Bcf/day Hugh Brinson pipeline by September 1 threatens to channel substantial Permian Basin associated gas directly toward Henry Hub, compounding domestic oversupply risks.
- Slipping LNG Feedgas Intake: Net natural gas flows to U.S. LNG export terminals recently slipped to 17.6 Bcf/day, weakening export demand at a critical time when domestic dry gas production is running near record highs. Any extended feedgas intake reductions or terminal maintenance events risk backing up additional supply into domestic storage.
- Seasonal Demand Fade and Strong Technical Resistance: Prompt-month natural gas futures have failed to sustain breakouts above the $2.80–$2.83/MMBtu technical resistance band, triggering systematic selling back toward key support around $2.70–$2.72. As late-August cooling demand peaks begin to wane ahead of the shoulder season, diminishing power burn leaves the market vulnerable to further technical liquidation.
Recommended Articles


