


Solana (SOLUSD) Suddenly Goes down 1.21% on Aug 11: What You Need to Watch
Solana (SOLUSD) is down 1.21% at Aug 11 03:20(ET), now at $74.52, with a 7-day up of 1.71%.
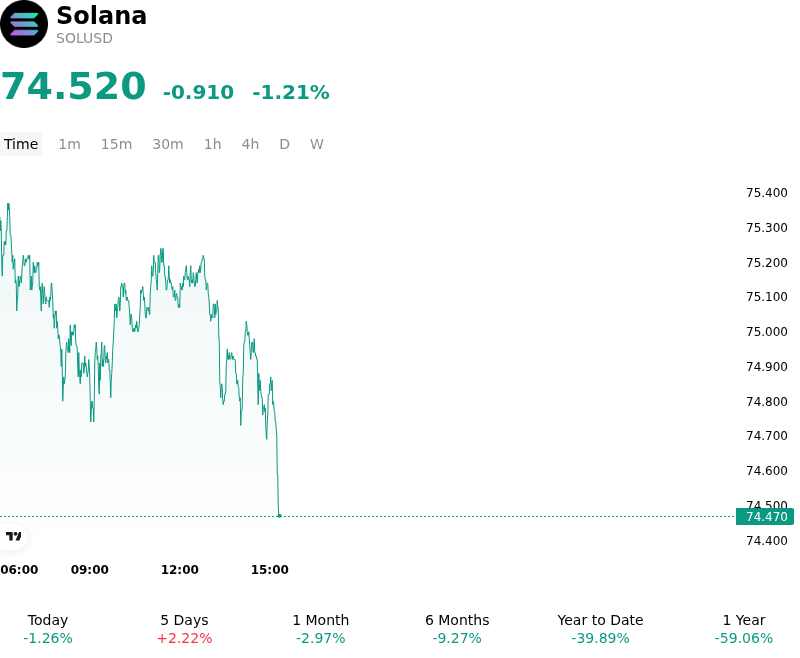
What is driving Solana (SOLUSD)’s stock price down today?
Solana experienced a modest pullback as broader market liquidity constraints and overhead technical resistance limited momentum across high-beta altcoins. Despite robust underlying network activity, short-term digital asset sentiment remains constrained by tighter macroeconomic conditions and persistent caution regarding the Federal Reserve's monetary policy trajectory. With benchmark Treasury yields holding at levels that incentivize capital preservation, institutional flows have predominantly favored primary digital assets, constraining fresh liquidity allocations into alternative layer-one protocols.
From a market structure perspective, the downside move reflects profit-taking and leverage reduction near key technical resistance zones. Derivatives data indicates a selective unwinding of leveraged long positioning following a period of consolidation, as traders de-risked portfolios ahead of upcoming macroeconomic data releases. While perpetual funding rates stayed relatively neutral, localized sell pressure and liquidity extraction in open-interest contracts exerted downward pressure on spot pricing, underscoring the sensitivity of current market depth.
Fundamental network metrics for Solana remain structurally solid, supported by ongoing enterprise adoption, growing stablecoin supply, and sustained throughput in real-world asset tokenization. However, the broader digital asset market continues to separate long-term infrastructure progress from immediate spot market pricing. In an environment defined by subdued retail participation and cautious institutional deployment, high transactional activity on-chain has not generated sufficient sustained spot buying demand to absorb tactical selling.
Looking ahead, Solana's near-term performance remains heavily tied to broader macroeconomic liquidity conditions and risk-asset appetite. Market participants continue to track regulatory clarity around digital asset market structure and overall capital flows across spot products. Until a systemic shift in global liquidity triggers a broader altcoin expansion, Solana remains sensitive to range-bound trading dynamics, technical overhead barriers, and leverage adjustments in derivatives markets.
Technical Analysis of Solana (SOLUSD)
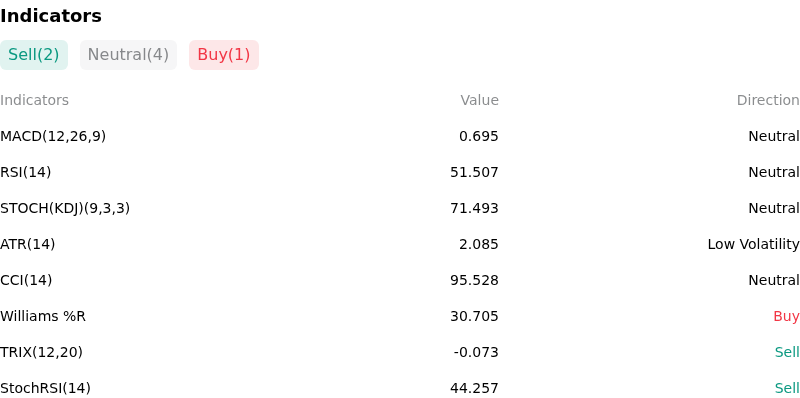
Technically, Solana (SOLUSD) shows a MACD (12,26,9) value of 0.695, indicating a neutral signal. The RSI at 51.507 suggests neutral condition and the Williams %R at 30.705 suggests buy condition. Please monitor closely.
More details about Solana (SOLUSD)
Recent Events and Risks:
- Elevated Derivatives Leverage and Liquidation Vulnerability: While spot buying volume remains constrained, derivatives markets exhibit concentrated long exposure, highlighted by recent whale transactions building $23 million in 20x leveraged long positions. With key liquidation clusters sitting tightly below immediate technical support, any sharp downward price impulse risks triggering automated margin calls and cascading liquidations.
- Divergent Spot Demand and Decelerating Institutional Inflows: On-chain metrics indicate cooling decentralized exchange (DEX) activity and negative money flow readings across Solana protocols. Concurrently, net institutional capital inflows into Solana-based investment products have decelerated, leaving price action overly dependent on speculative derivatives rather than organic buy-side spot accumulation.
- Macro Pressure and Pre-CPI Market De-risking: Firm U.S. Treasury yields and a resilient U.S. dollar have driven a broader risk-off posture across digital asset markets ahead of upcoming U.S. CPI inflation data. This macro liquidity tightening has disproportionately pressured high-beta Layer-1 assets like Solana as traders rotate capital into defensive holdings.
- Persistent Regulatory and Security Classification Overhang: Continued regulatory uncertainty surrounding the U.S. SEC's classification of SOL as an unregistered security in ongoing litigation against domestic exchanges remains a structural headwind. This legal friction creates ongoing compliance risks for institutional investors and creates domestic exchange listing uncertainty.
Recommended Articles


