


EUR/GBP Price Forecast: Under growing bearish pressure below 0.8550
- EUR/GBP consolidates near two-week lows below 0.8550.
- The stalled US-Iran peace plan and higher Oil prices are adding pressure on the Euro
- Confirmation below the 0.8550 support area would bring 0.8530 and 0.8510 targets into focus.
The Euro (EUR) extends losses for the second consecutive day against the British Pound (GBP) on Tuesday, weighed by a cautious market mood as hopes of a swift end to Iran’s war wane and Oil prices climb. The EUR USD pair remains capped below 0.8550 after hitting two-week lows at 0.8536 on Monday.
In the absence of key macroeconomic releases in the UK or the Eurozone, geopolitical tensions are the main market driver on Tuesday. In that sense, Strategists at Rabobank caution that, although the Eurozone's economy seems to have weathered the higher energy prices and supply disruptions from the closure of the Strait of Hormuz, the breakdown of the US-Iran peace agreement "clearly implies downside risks to growth and upside inflation concerns,” posing a heavy weight on the Euro.
Technical Analysis: Bears remain in control while below 0.8550
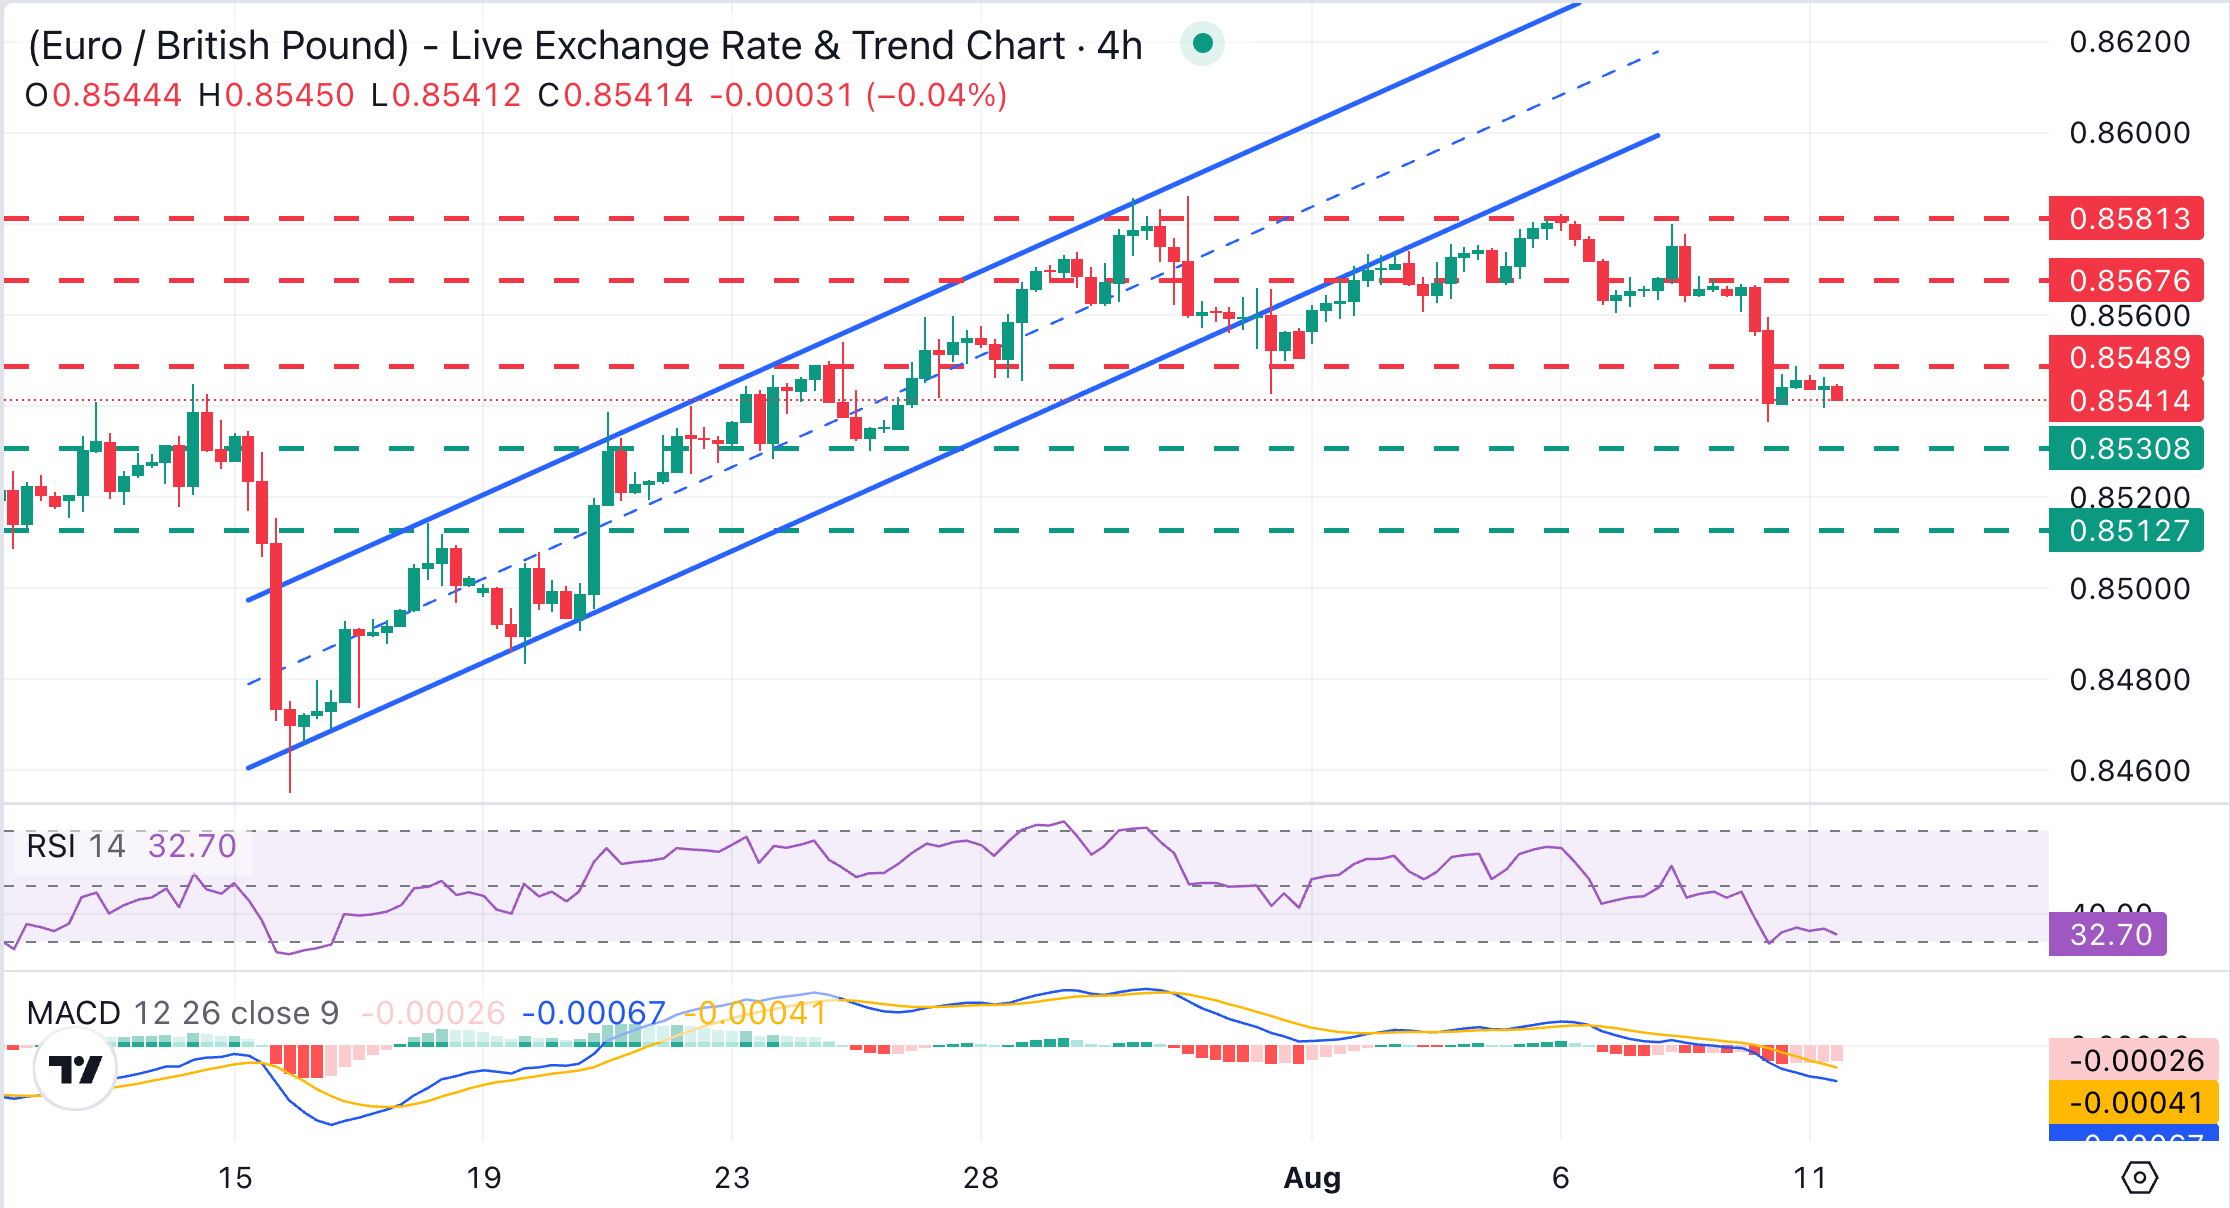
EUR/GBP broke the ascending channel in late July, and confirmed a bearish reversal this week after slipping below a previous support at the 0.8550 area, which is now holding bulls. Momentum indicators endorse the bearish view, with the 4-hour Relative Strength Index (14) hovering in the mid-30s and the Moving Average Convergence Divergence (MACD) at slightly negative levels.
Initial support emerges at 0.8530 (July 24 low) and below here, a previous resistance area, around 0.8510. On the topside, the mentioned 0.8550 area should be broken to bring price action back to the previous ranges and shift the focus back to Monday's highs, at 0.8566 and the August 5 and 6 highs, near 0.8580.
(The technical analysis of this story was written with the help of an AI tool. Know more.)
Euro Price Today
The table below shows the percentage change of Euro (EUR) against listed major currencies today. Euro was the strongest against the New Zealand Dollar.
| USD | EUR | GBP | JPY | CAD | AUD | NZD | CHF | |
|---|---|---|---|---|---|---|---|---|
| USD | 0.09% | 0.04% | 0.02% | -0.01% | -0.00% | 0.19% | 0.10% | |
| EUR | -0.09% | -0.04% | -0.07% | -0.08% | -0.05% | 0.11% | 0.01% | |
| GBP | -0.04% | 0.04% | -0.04% | -0.05% | -0.02% | 0.15% | 0.05% | |
| JPY | -0.02% | 0.07% | 0.04% | -0.01% | 0.00% | 0.18% | 0.09% | |
| CAD | 0.00% | 0.08% | 0.05% | 0.01% | 0.03% | 0.19% | 0.09% | |
| AUD | 0.00% | 0.05% | 0.02% | -0.01% | -0.03% | 0.16% | 0.07% | |
| NZD | -0.19% | -0.11% | -0.15% | -0.18% | -0.19% | -0.16% | -0.09% | |
| CHF | -0.10% | -0.01% | -0.05% | -0.09% | -0.09% | -0.07% | 0.09% |
The heat map shows percentage changes of major currencies against each other. The base currency is picked from the left column, while the quote currency is picked from the top row. For example, if you pick the Euro from the left column and move along the horizontal line to the US Dollar, the percentage change displayed in the box will represent EUR (base)/USD (quote).
Recommended Articles


