


Bitcoin (BTCUSD) Is up 1.08% on Aug 7: What Do On-Chain Data and Market Sentiment Show?
Bitcoin (BTCUSD) is up 1.08% at Aug 7 07:25(ET), now at $65107.77, with a 7-day up of 3.47%.
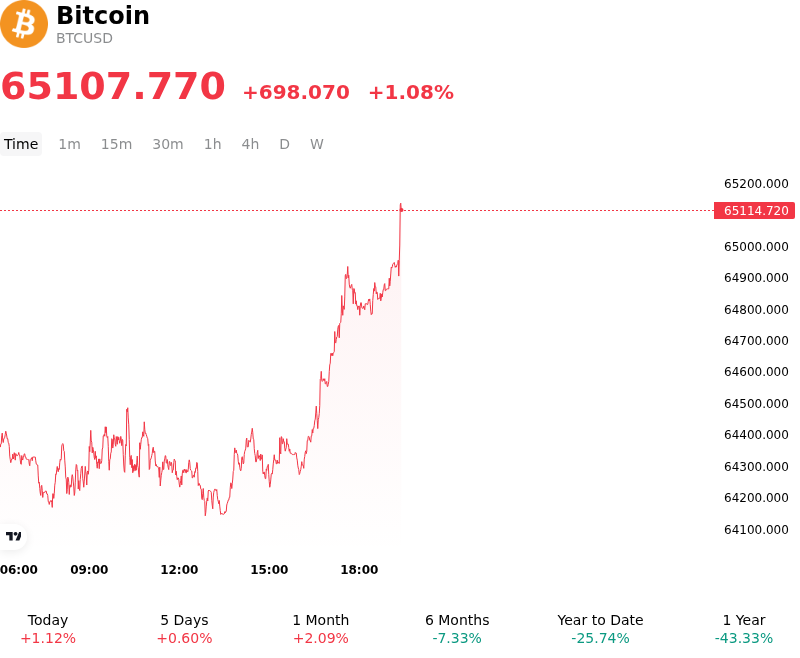
What is driving Bitcoin (BTCUSD)’s stock price up today?
The advance in Bitcoin reflects a tactical shift in global liquidity expectations as market participants increasingly price in a more accommodative stance from the Federal Reserve. Recent economic data suggests a structural stabilization of inflationary pressures, leading to a softening in U.S. Treasury yields. This decline in yields has diminished the opportunity cost of holding non-yielding digital assets, prompting a rotation out of defensive cash-equivalent instruments into high-beta risk assets. The resulting downward pressure on the U.S. Dollar Index has provided a significant tailwind for Bitcoin, which continues to trade as a primary hedge against fiat currency debasement.
Institutional demand remains the core driver of the current price action, evidenced by sustained positive net inflows into spot Bitcoin ETFs. This professionalized capital flow represents a maturing segment of the market that is less susceptible to retail sentiment and more focused on long-term portfolio allocation. The consistent absorption of circulating supply by these institutional vehicles is tightening liquid exchange balances, creating a supply-demand imbalance that favors upward price discovery. We are observing a transition from speculative trading toward systematic accumulation by diversified funds and corporate treasuries, which provides a structural floor for valuations during periods of volatility.
From a positioning perspective, the intraday volatility was amplified by a squeeze in the derivatives market. As Bitcoin cleared key technical resistance levels, the forced liquidation of short positions in the perpetual futures market provided the necessary buy-side momentum to sustain the move. Open interest across major derivatives exchanges remains elevated, indicating that institutional traders are positioning for a potential breakout from the recent consolidation range. The lack of immediate regulatory headwinds has allowed the market to refocus on the fundamental narrative of Bitcoin as a decentralized store of value within a broader digital finance ecosystem.
While the current trajectory is supported by favorable macro conditions and institutional participation, the market remains sensitive to shifts in global central bank policies and labor market health. The structural trend appears robust, driven by the ongoing integration of digital assets into traditional financial infrastructure. Investors are closely monitoring the sustainability of ETF flows and potential changes in the Federal Reserve’s balance sheet management, as these factors will likely dictate the next phase of capital allocation in the digital asset space.
Technical Analysis of Bitcoin (BTCUSD)
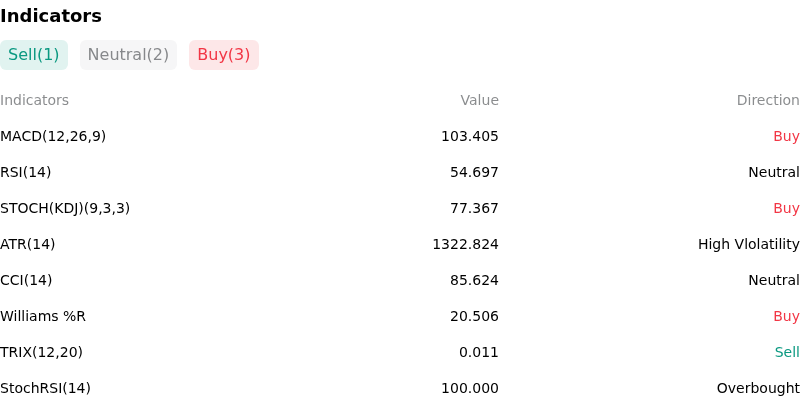
Technically, Bitcoin (BTCUSD) shows a MACD (12,26,9) value of 103.405, indicating a buy signal. The RSI at 54.697 suggests neutral condition and the Williams %R at 20.506 suggests buy condition. Please monitor closely.
More details about Bitcoin (BTCUSD)
Recent Events and Risks:
- Accelerated Spot ETF Outflows: Recent cooling in institutional demand has manifested as significant net outflows from major US-based spot Bitcoin ETFs over the last 48 hours, signaling a shift in sentiment among wealth managers and creating immediate sell-side pressure on spot markets.
- Government-Linked On-Chain Activity: Blockchain monitoring has identified the movement of large quantities of Bitcoin from wallets associated with sovereign seizures to centralized exchange deposit addresses, raising market fears of imminent large-scale liquidations that could thin out current bid-side liquidity.
- Macroeconomic Volatility and USD Strength: A resurgent US Dollar Index (DXY) paired with hawkish commentary from central bank officials regarding persistent inflation has dampened "risk-on" appetite, leading to capital rotation out of digital assets and into traditional fixed-income instruments.
- Heightened Derivatives Liquidation Risk: A buildup of leveraged long positions near key resistance levels has created a fragile market structure, where a minor price retracement risks triggering a cascading "long squeeze" and automated liquidation events across major perpetual swap exchanges.
Recommended Articles


