


Nebius Stock Price Forecast: Will Upcoming Q2 Earnings Drive NBIS Stock Higher?
TradingKey - As demand for AI computing power continues to heat up, emerging cloud provider Nebius (NBIS) is about to report its highly anticipated second-quarter financial results. The company will announce its second-quarter 2026 results after the US market close on August 12.
Over the past month, NBIS shares have pulled back by about 9% cumulatively, but remain up around 122% year-to-date. Notably, driven by CoreWeave's strong earnings report, NBIS rose by about 8% at one point in after-hours trading on August 11, indicating that market optimism for AI computing demand remains intact.
As the earnings report approaches, investors are waiting for Nebius to provide new growth signals.
Nebius Q2 Revenue May Surge Over 4-Fold YoY
In terms of market expectations, the key highlight of Nebius's second-quarter performance remains its revenue growth. Wall Street expects the company's second-quarter revenue to reach approximately $570 million to $580 million, compared with just around $105 million in the same period last year, representing a year-over-year increase of more than fourfold. Some market consensus estimates even reach $581 million, corresponding to a year-over-year growth of about 474%.
This rapid growth rate is primarily driven by the continuous expansion of demand for AI infrastructure. As large model training, inference, and AI agent applications consume an increasing amount of GPU compute power, emerging cloud service providers focused on AI infrastructure, such as Nebius, are securing more orders.
However, rapid revenue growth has not translated into profitability in tandem. The market expects Nebius's second-quarter adjusted loss per share to be around $0.69 to $0.72, significantly higher than the loss level of about $0.33 to $0.38 per share in the same period last year; EBIT loss is expected to be around $314 million.
This indicates that Nebius remains in a stage of exchanging massive investment for revenue growth. For the upcoming earnings release, while whether revenue exceeds $580 million is certainly important, investors are more eager to see whether there is improvement in profit margins, cash flow, and capital investment efficiency.
Historically, Nebius has beaten analyst expectations on adjusted earnings per share for several consecutive quarters, though instances of revenue beats have been relatively limited.
AI Computing Demand Is Strong, But Capacity Expansion Becomes Key
Nebius's biggest advantage currently remains strong demand for AI infrastructure.
CoreWeave recently reported second-quarter results that significantly beat market expectations, with revenue more than doubling year-over-year, order backlog reaching approximately $104 billion, and over $25 billion in new customer commitments added at the start of Q3. This earnings report further reinforced the market consensus that demand for AI computing power remains robust. The strong order data prompted the market to reevaluate the growth potential of the AI infrastructure industry, directly boosting the stock prices of neocloud companies like Nebius.
Therefore, investors are likely to look for similar signals in Nebius's earnings report, including customer orders, computing power utilization, data center construction progress, and future capacity.
However, the issue is that booming AI demand does not mean Nebius can immediately convert orders into revenue. The company's pace of expansion remains constrained by data center construction, power supply, and GPU deployment capabilities.
This is also the core contradiction Nebius currently faces: customer demand is already strong enough, but can the company's infrastructure keep up in a timely manner?
If the earnings report shows smooth capacity expansion and the company can further increase its computing power supply and utilization, strong demand is expected to continue translating into revenue growth; conversely, if data center construction progress falls below expectations, the pace of revenue realization could be impacted even with ample orders.
Wall Street Leans Bullish, Highest Price Target at $286
Despite capacity and profitability pressures, Wall Street overall remains relatively positive on Nebius.
Source: TipRanks
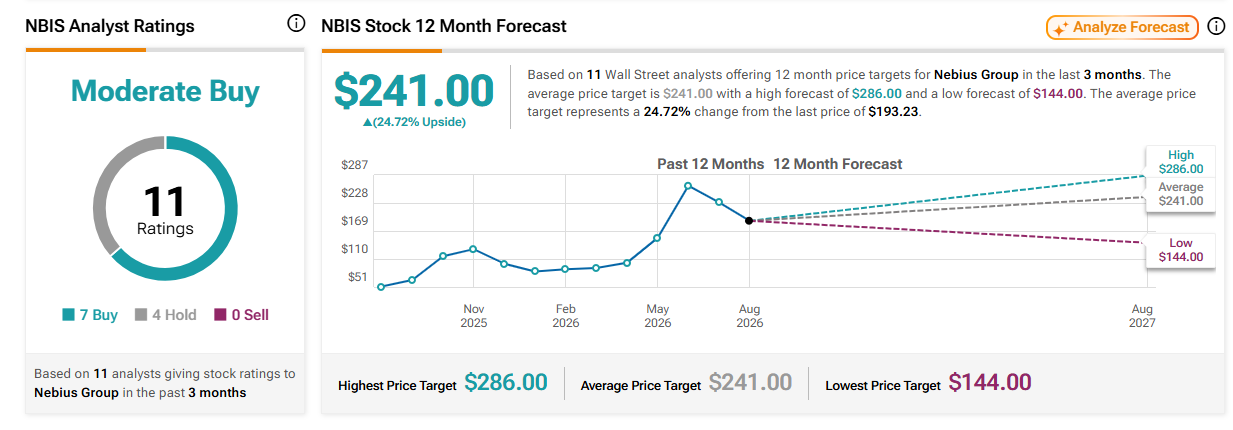
Based on forecasts from 11 Wall Street analysts over the past three months, Nebius's average 12-month price target is $241, representing an upside potential of approximately 24.72% from current stock price levels, with a high target of $286 and a low of $144. In terms of ratings, 7 of the 11 analysts rate it a "Buy", 4 recommend a "Hold", and none rate it a "Sell".
Among them, Goldman Sachs analyst Alexander Duval maintains a "Buy" rating on Nebius with a price target of $286. He believes that what investors need to focus on next is not just revenue growth, but whether robust demand for AI computing power and sustained pricing power can drive Nebius to further raise its full-year guidance.
Duval noted that Nebius previously stated its existing capacity remains near sold out even after raising prices for computing power. This implies that the AI infrastructure market remains in a state where demand exceeds supply. If this trend continues, Nebius will not only be able to improve the utilization rate of its existing computing resources, but is also expected to gain stronger pricing power, thereby further improving its profitability.
Nebius Stock Price Technical Analysis
Source: TradingView
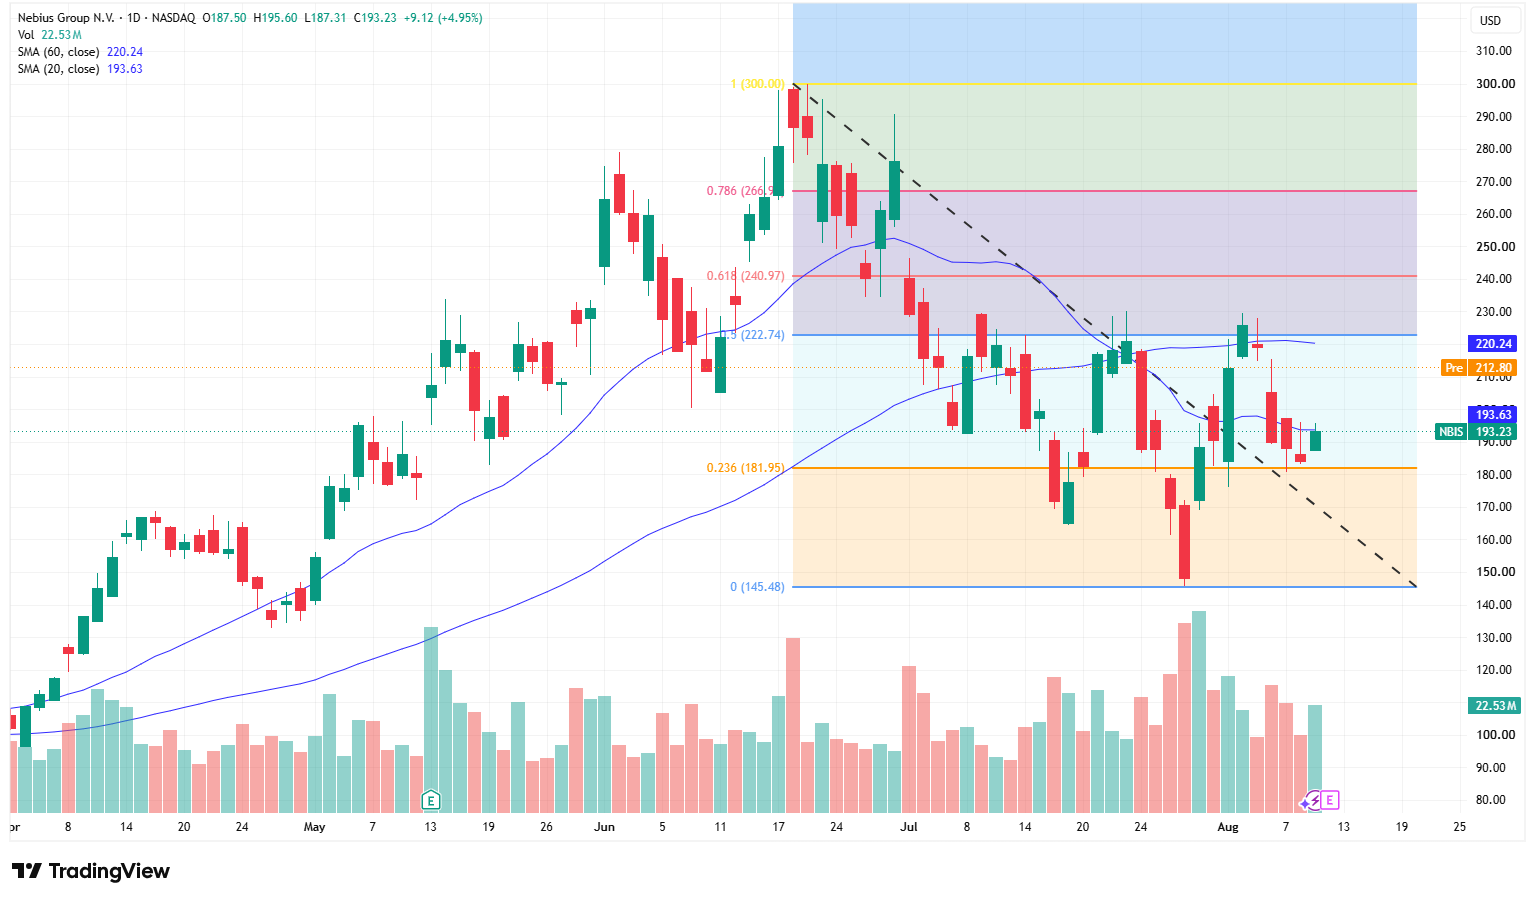
On the daily chart, NBIS entered a medium-term correction after hitting a high of $300 in June, and has yet to fully break out of its downtrend structure. The closing price of $193.23 is slightly below the 20-day moving average of $193.63 and significantly below the 60-day moving average of $220.24, indicating that the stock is stabilizing in the short term, but a trend reversal still requires further confirmation.
The most critical post-earnings resistance level is at $220–$223. This area coincides with both the 60-day moving average and the 50% Fibonacci retracement level at $222.74. If the stock breaks out on high volume and holds above this area, the next targets would be $241 and $267 in sequence; if market sentiment continues to heat up, a retest of the previous high of $300 cannot be ruled out.
Conversely, if gains recede and the stock falls below $193 again, it may retest support at $181.95; should $181 fail to hold, downside risk will expand to $165–$170, and in an extreme scenario, it could retest near $145.
Recommended Articles


