


Ripple and Stellar outlook: Hold bullish bias above EMAs as derivatives back upside
- XRP trades at $1.40 on Tuesday, holding above the key 200-day EMA support at $1.35.
- XLM holds above the dense band of EMA resistance, keeping the near-term bias bullish.
- Derivatives data for both altcoins signal a bullish bias, with positive funding rates and rising long positions.
Ripple (XRP) and Stellar (XLM) hold above the key support zones on Tuesday, hinting at an upside move. Derivatives metrics further support the recovery, with both altcoins showing positive funding rates and rising long positions.
Derivatives metrics signal a bullish outlook
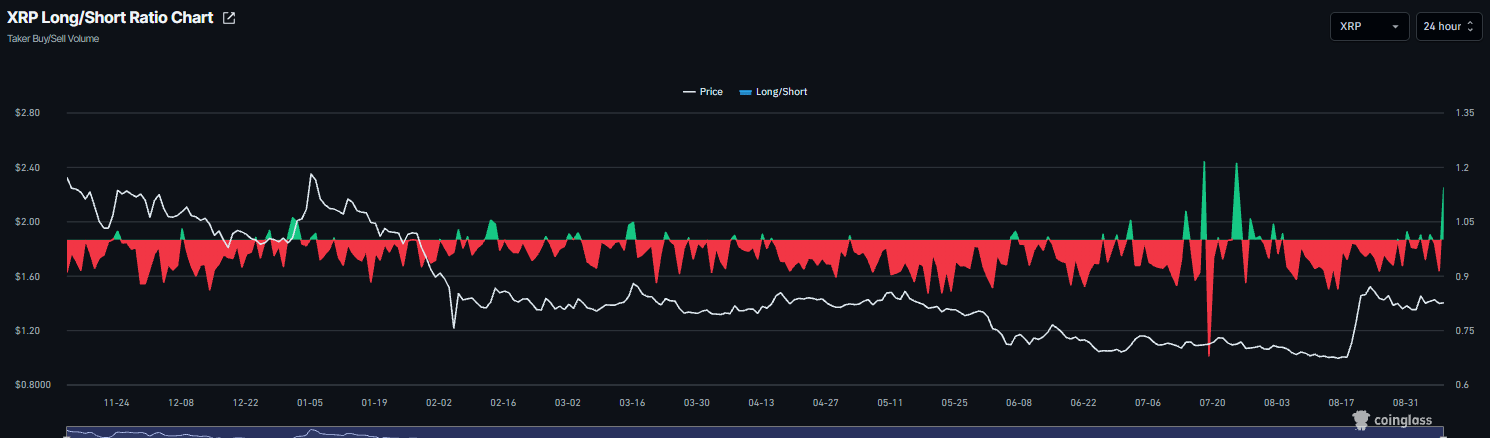
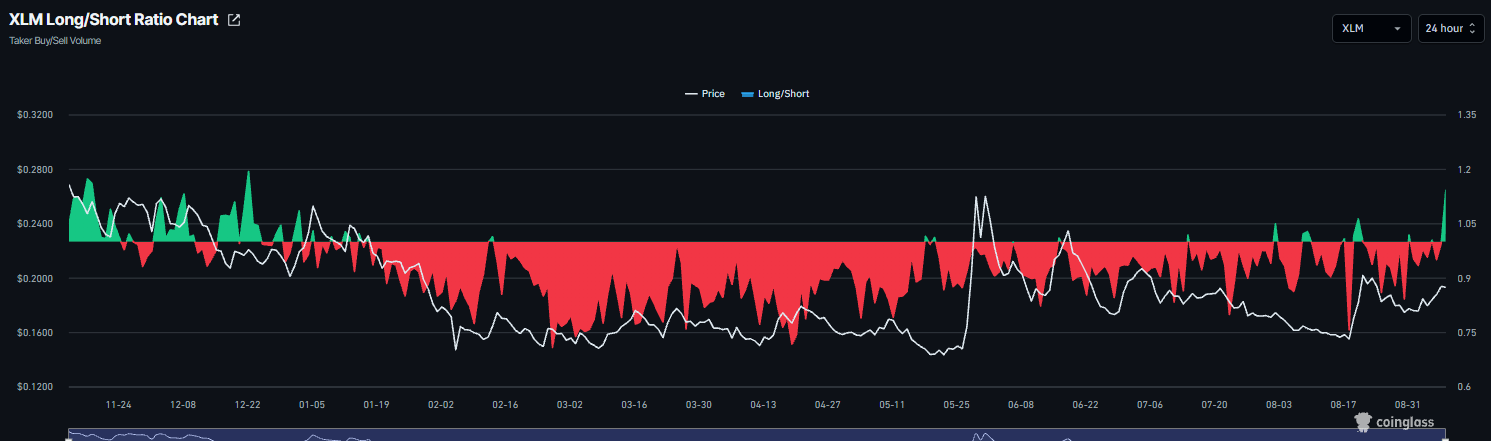
Derivatives data shows a bullish tilt among XRP and XLM traders. CoinGlass’ long-to-short ratios for Ripple and Stellar read 1.14 and 1.15, respectively, on Tuesday, nearing their highest levels in a month. A ratio above one indicates bullish sentiment, as traders bet asset prices will rise.
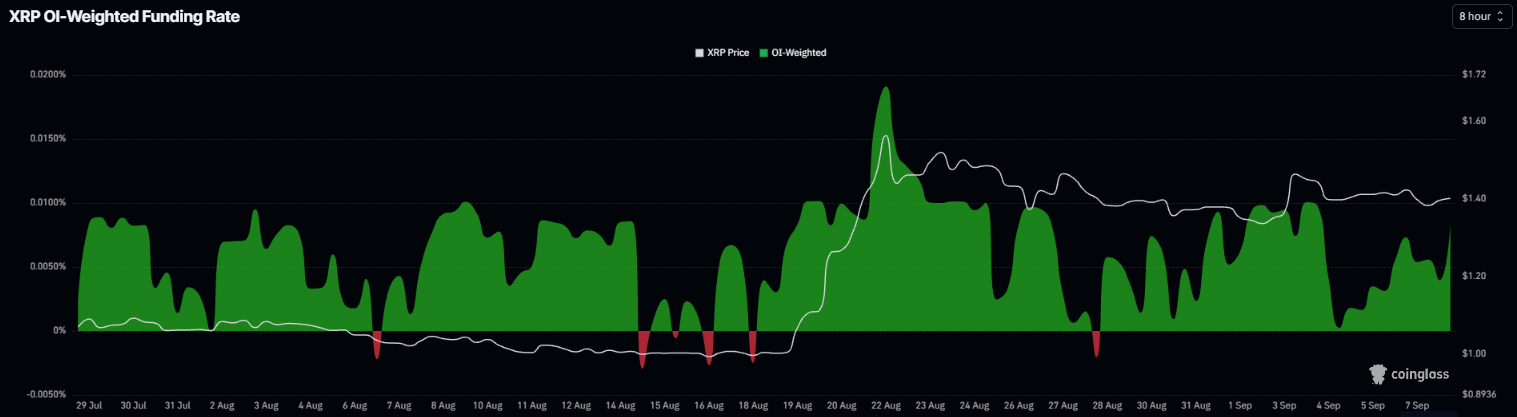
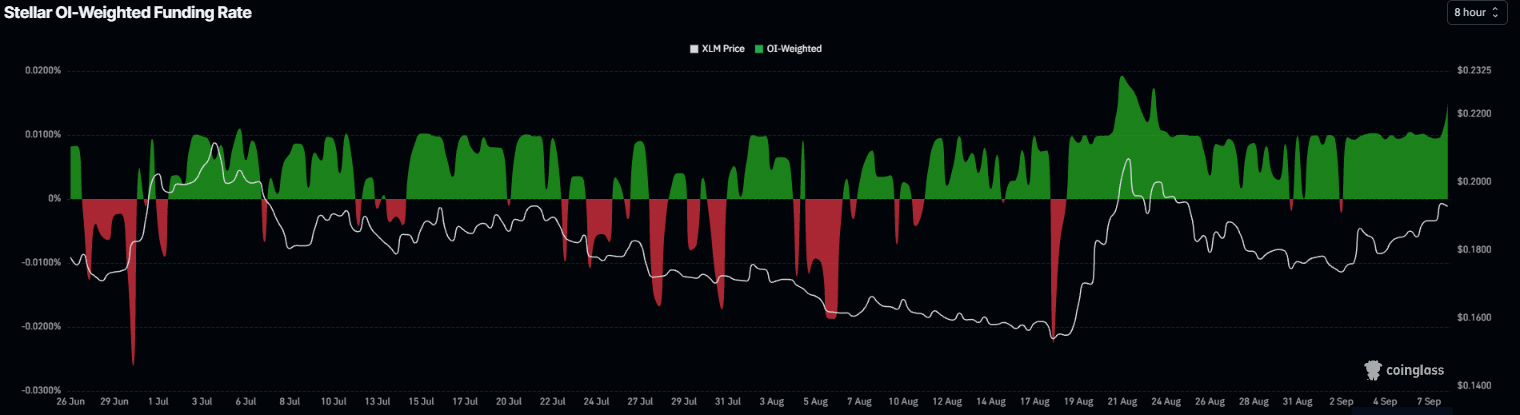
In addition, the funding rates for both altcoins also support a bullish bias. XRP funding rate flipped positive on August 28 and read 0.0084% on Tuesday. Similarly, the XLM funding rate flipped positive on September 2 and read 0.0147% on Tuesday, indicating that longs are paying shorts and reflecting a bullish outlook for XRP and XLM.
XRP technical outlook: 200-day EMA holds strong
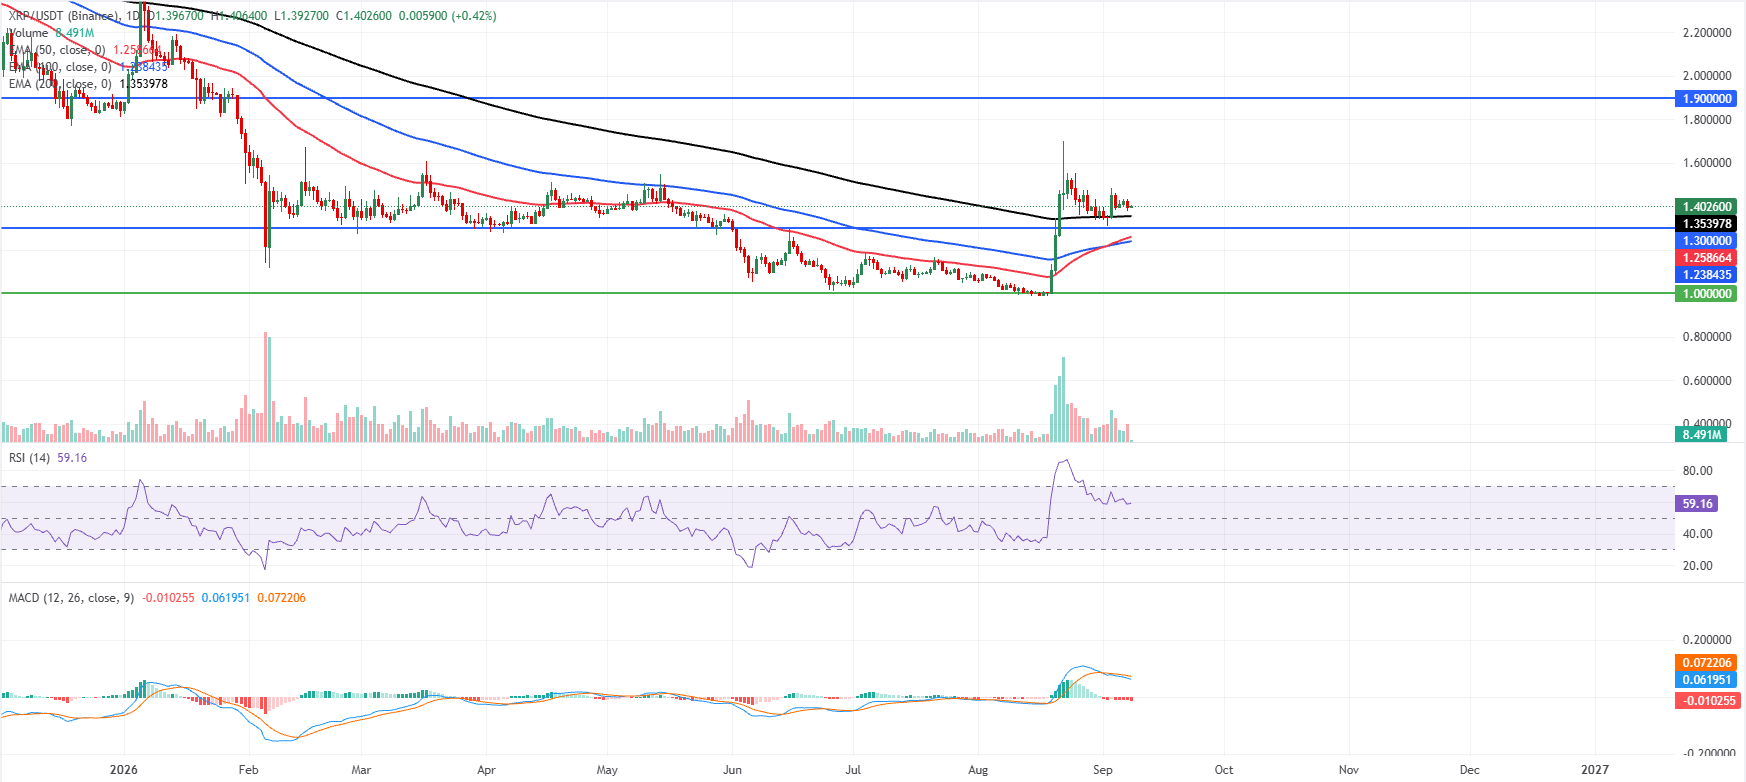
XRP price trades at $1.402 on Tuesday, maintaining a constructive bullish bias as it holds above the 50-day, 100-day and 200-day Exponential Moving Averages (EMAs), clustered between roughly $1.240 and $1.350. This positioning suggests the broader uptrend remains supported despite a recent loss of upside momentum, with the Relative Strength Index (RSI) near 59 hinting at still-positive but moderating strength. At the same time, the Moving Average Convergence Divergence (MACD) has slipped slightly into negative territory, signaling a tentative consolidation phase rather than a clear reversal.
On the downside, initial support is seen around the 200-day EMA at $1.353, with additional demand expected near the horizontal level at $1.300 and deeper protection coming from the 50-day EMA at $1.258 and the 100-day EMA at $1.238, ahead of the more distant structural floor at $1.000.
On the topside, bulls face a key hurdle at the horizontal resistance around $1.900, and a daily close above this barrier would be needed to reopen the path toward higher highs and reinforce the broader bullish structure.
XLM technical outlook: Extends its recovery above the EMAs
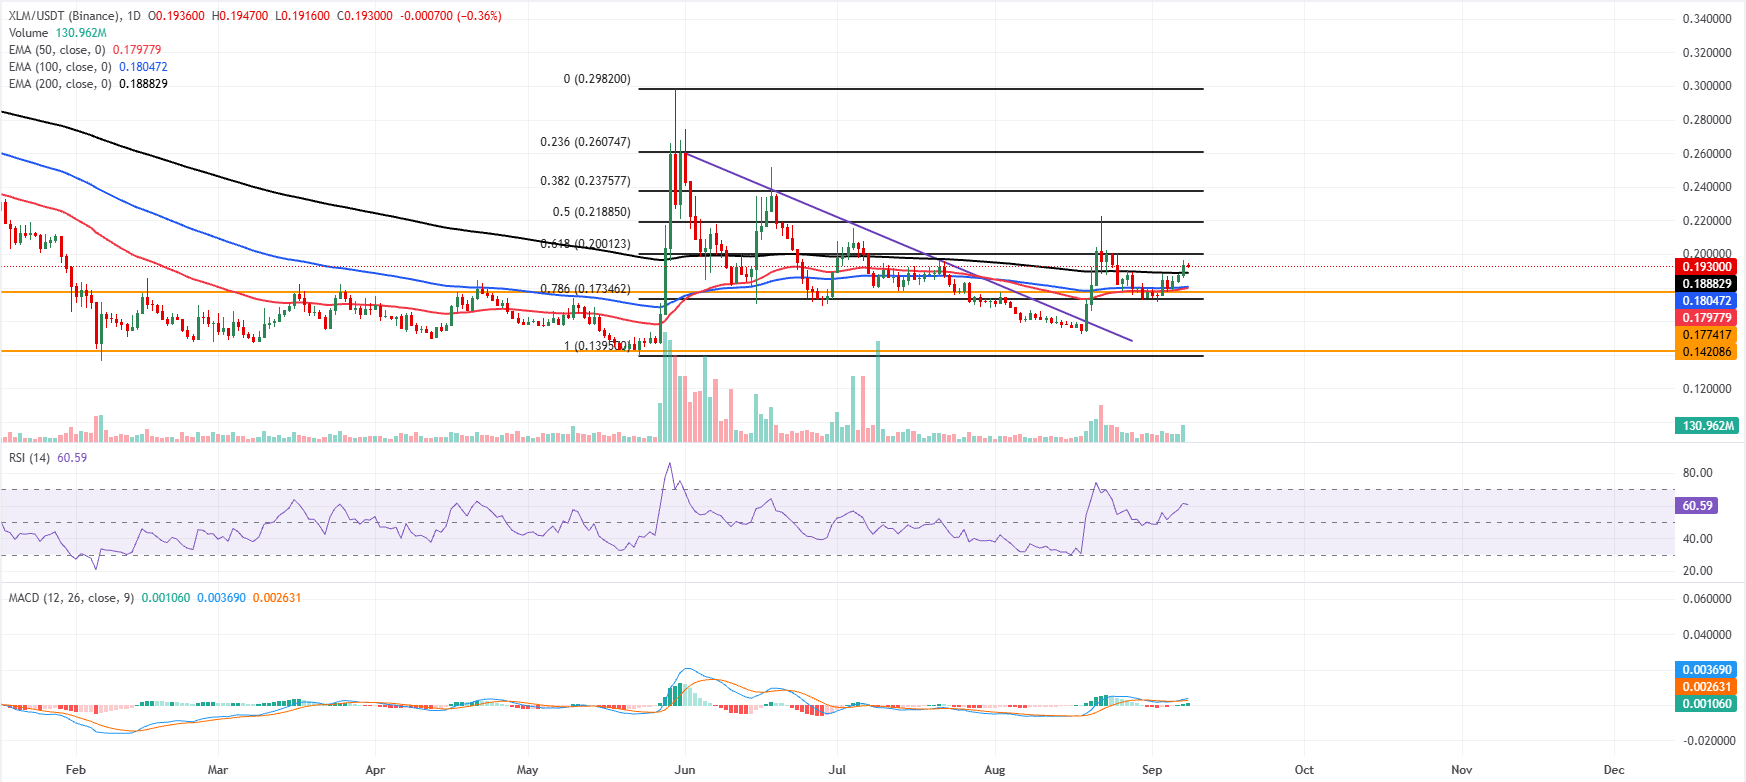
XLM price trades at $0.193 on Tuesday, extending its recovery above the EMAs and tilting the near-term bias to the upside. The 50-day, 100-day and 200-day EMAs clustered between roughly $0.180 and $0.190 now act as a rising demand band beneath price, suggesting dip-buying interest on setbacks.
The RSI holds in bullish territory around 60, while the MACD histogram stays mildly positive with the line above the signal, hinting that bullish momentum remains constructive but not yet overstretched.
On the topside, initial resistance appears at the 61.8% Fibonacci retracement of the latest swing near $0.200, with further hurdles at the 50% retracement around $0.218 and the 38.2% Fibonacci retracement level near $0.237. A sustained break above those barriers could open the way toward the descending trendline resistance and the 23.6% Fibonacci retracement level in the $0.260 region.
On the downside, immediate support is seen at the 200-day EMA near $0.188, followed by the 100-day EMA at $0.180 and the 50-day EMA around $0.179. A deeper pullback would expose the horizontal floor at $0.177 and the 78.6% Fibonacci retracement near $0.173, where buyers would be expected to defend the broader upturn before the more distant supports at $0.142 and $0.139 come into focus.
(The technical analysis of this story was written with the help of an AI tool. Know more.)
บทความแนะนำ


