


Ripple and Stellar outlook: XRP and XLM lose ground as hawkish Fed tone weighs
- XRP extends its correction toward $1.30 as the Fed holds rates unchanged with a hawkish tone.
- XLM slips over 2% on Thursday after three consecutive days of recovery so far this week.
- Weakening derivatives metrics and bearish on-chain data cap both altcoins’ recovery.
Ripple (XRP) and Stellar (XLM) remain under pressure on Thursday as bearish derivatives positioning and on-chain signals weigh on sentiment. XRP slides toward key support at $1.30, while XLM gives back some of its recent gains.
Meanwhile, the Federal Reserve (Fed) held interest rates unchanged at 3.75%-4.00% at its two-day October policy meeting. However, the cautious hold, with a hawkish undertone and inflation concerns, adds to a cautious market backdrop and weighs on risky assets such as XRP and XLM.
Derivatives metrics support a bearish outlook
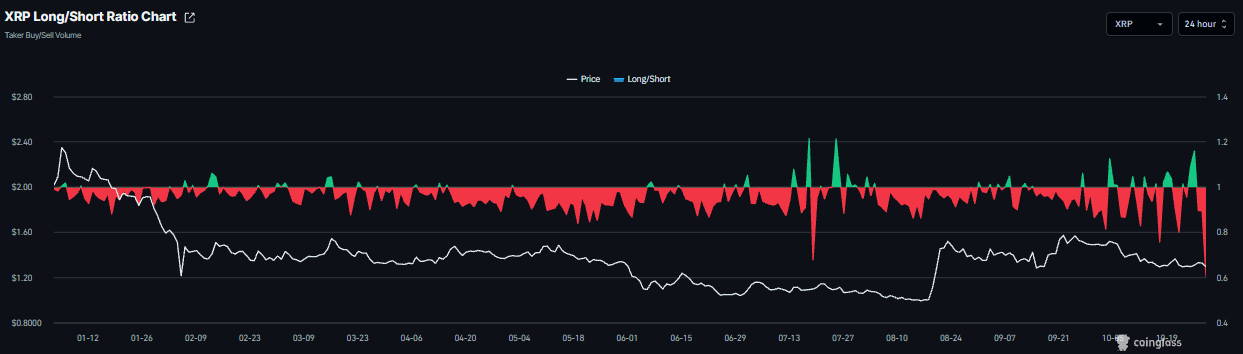
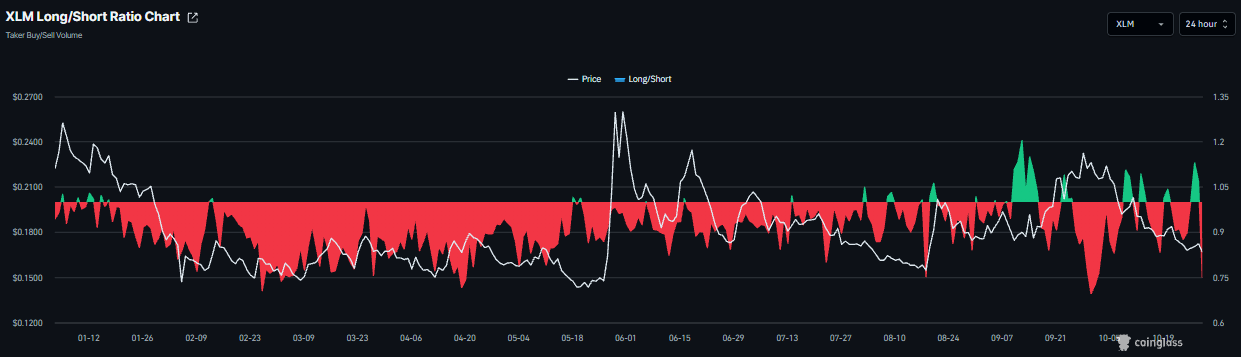
Derivatives data shows weakening conditions for Ripple and Stellar. CoinGlass’ long-to-short ratios for XRP and XLM read 0.60 and 0.74, respectively, on Thursday, nearing the lowest level over a month. A ratio below one indicates bearish sentiment, as traders bet that asset prices will fall.
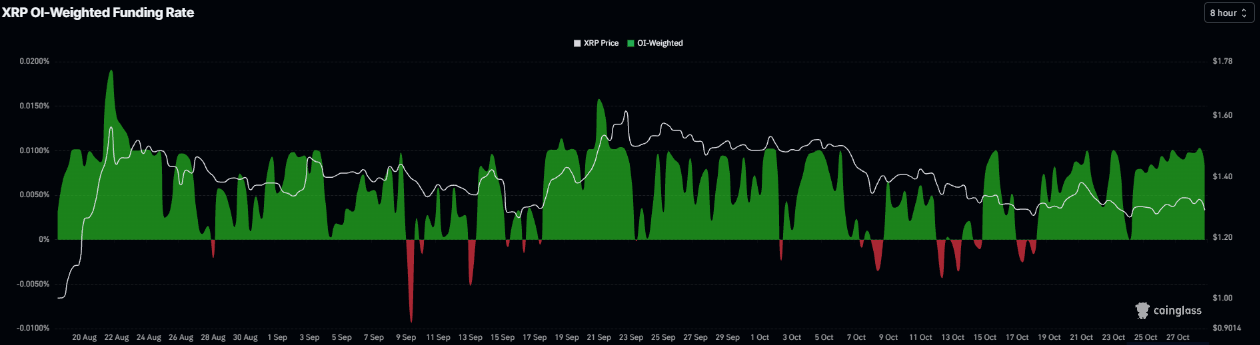
However, XRP funding rates flipped positive on October 16 and read 0.0080% on Thursday, indicating that longs are paying shorts and suggesting a mildly bullish outlook.
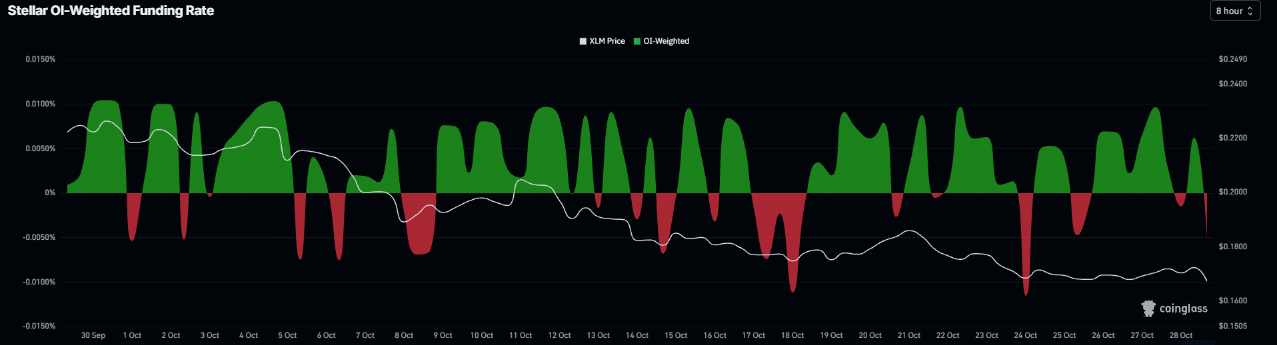
Meanwhile, XLM funding rates flipped negative on Thursday, reading -0.0051%, indicating that shorts are paying longs and suggesting a bearish bias.
On-chain data shows cautious sentiment
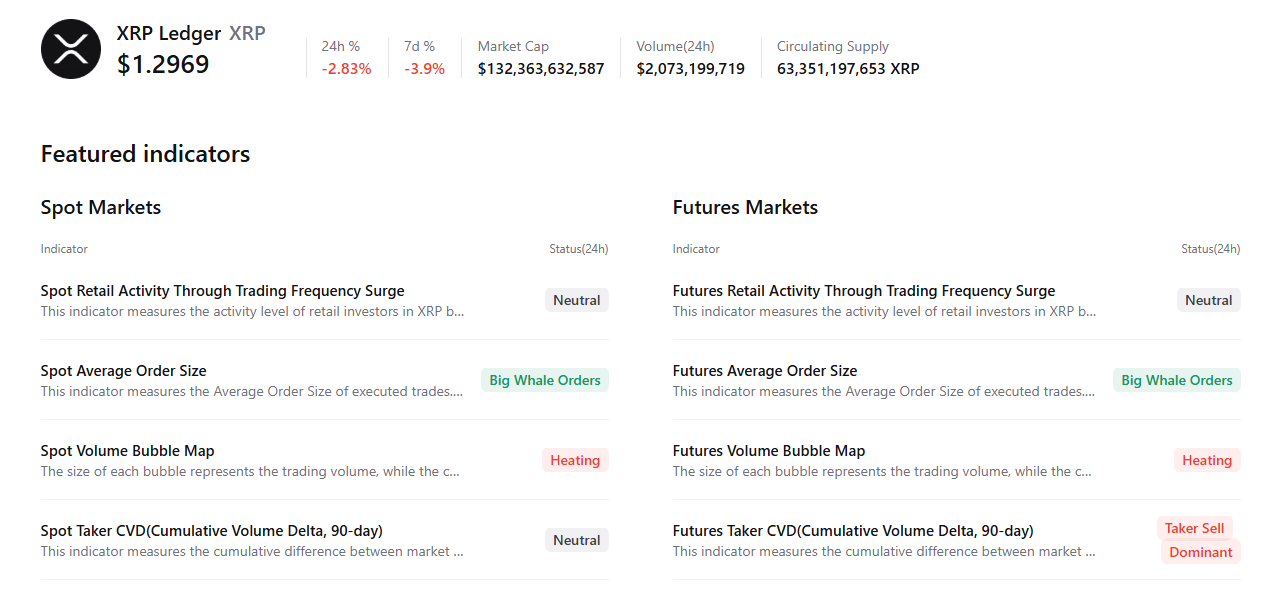
CryptoQuant’s summary data shows a bearish outlook for both altcoins. XRP’s spot and futures markets show large whale orders alongside heating conditions and sell-side dominance. These highlight a bearish, cautious sentiment bias among Ripple traders.
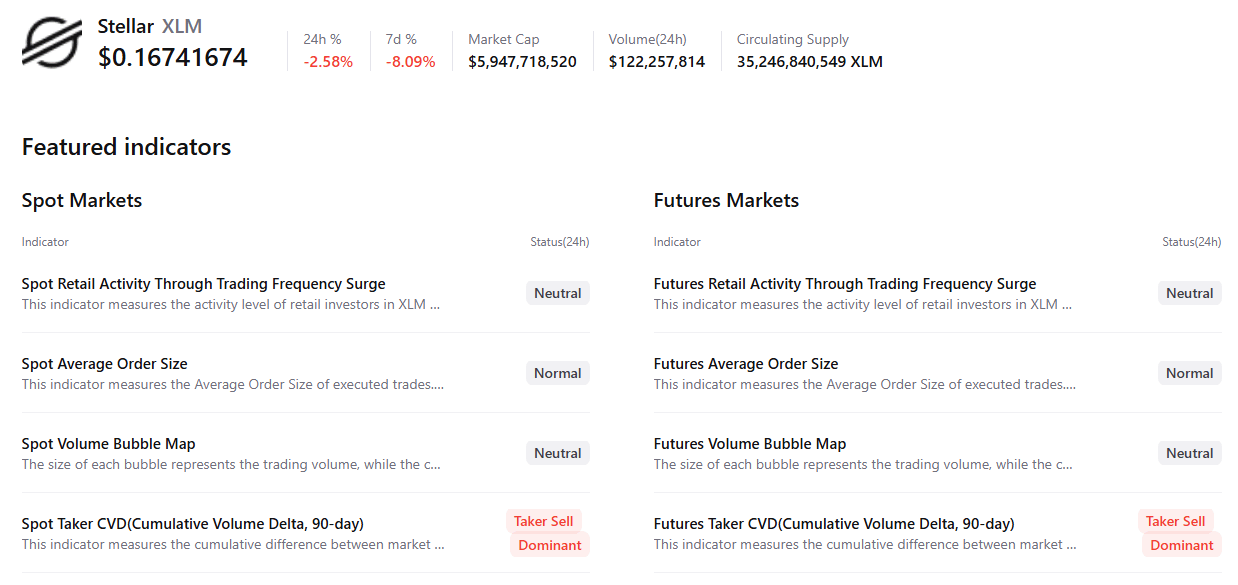
For XLM, spot and futures markets show sell-side dominance, indicating a negative outlook among Stellar traders.
XRP technical outlook: Heading toward key support at $1.300
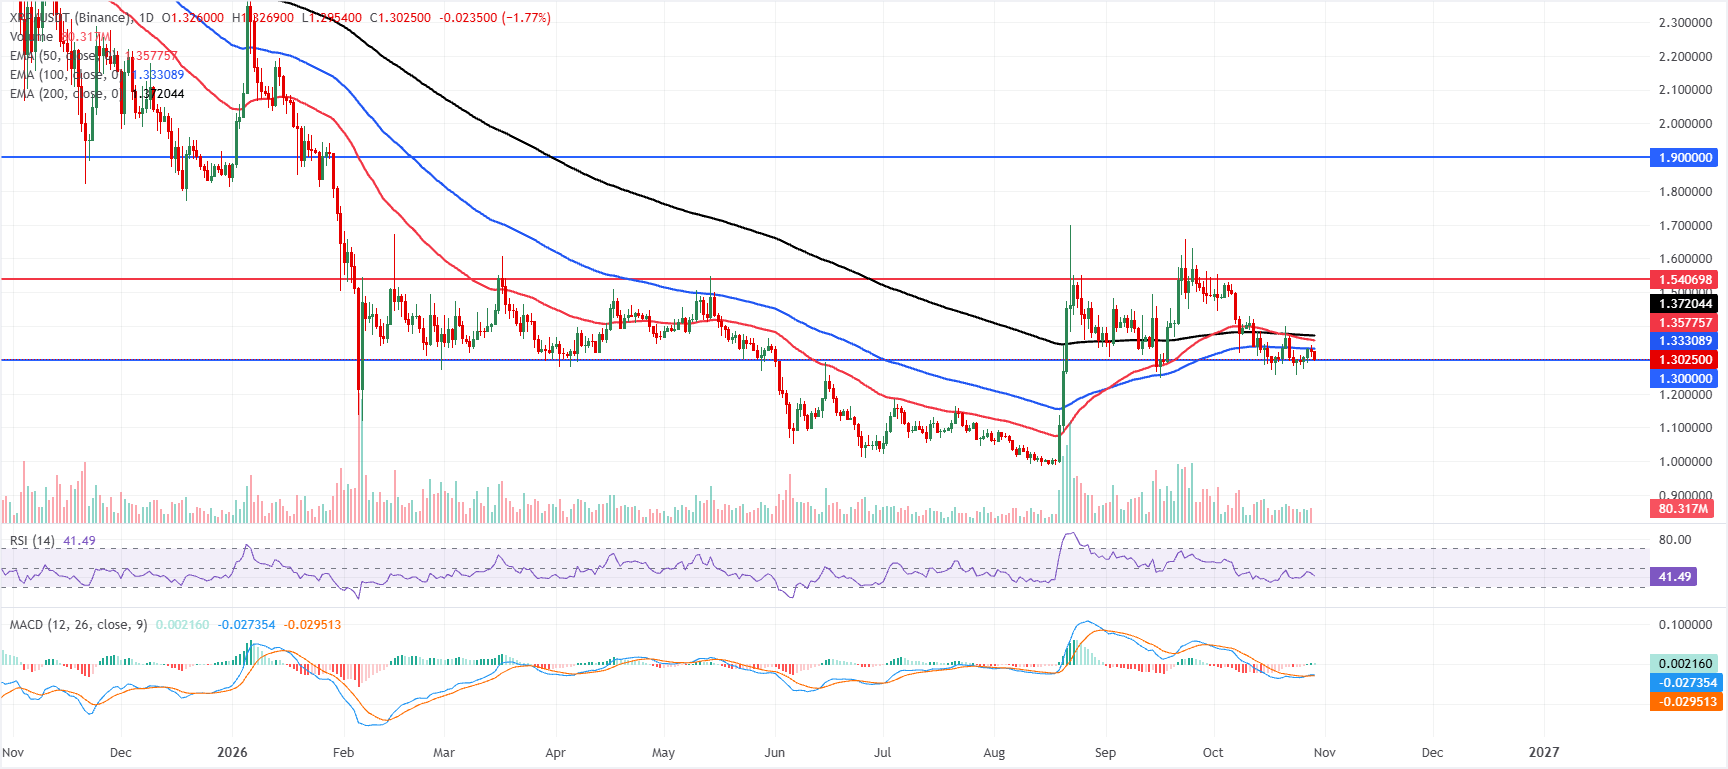
XRP price trades at $1.302 on Thursday, retaining a bearish near-term bias as it holds marginally above the $1.300 horizontal support but well below the key Exponential Moving Averages (EMAs). The 100-day EMA at $1.333, the 50-day EMA at $1.357 and the 200-day EMA at $1.372 all sit overhead, suggesting the recent recovery is capped by a dense band of trend resistance.
Momentum is subdued, with the Relative Strength Index (RSI) at 41 hinting at lingering downside pressure despite a modest improvement in the Moving Average Convergence Divergence (MACD), which has turned slightly positive above the zero line.
On the downside, immediate support is located at the recently defended horizontal floor near $1.300, where a clean break would likely expose a deeper corrective leg in the coming sessions.
On the topside, initial resistance appears at the 100-day EMA around $1.333, followed by the 50-day EMA near $1.357 and the 200-day EMA at $1.372, which together define the key area bulls would need to reclaim to ease the bearish tone. Above that, a more substantial barrier sits at $1.540, ahead of the major resistance level at $1.900, where previous supply is likely to re-emerge if the pair extends a sustained recovery.
XLM technical outlook: Weakening momentum indicators
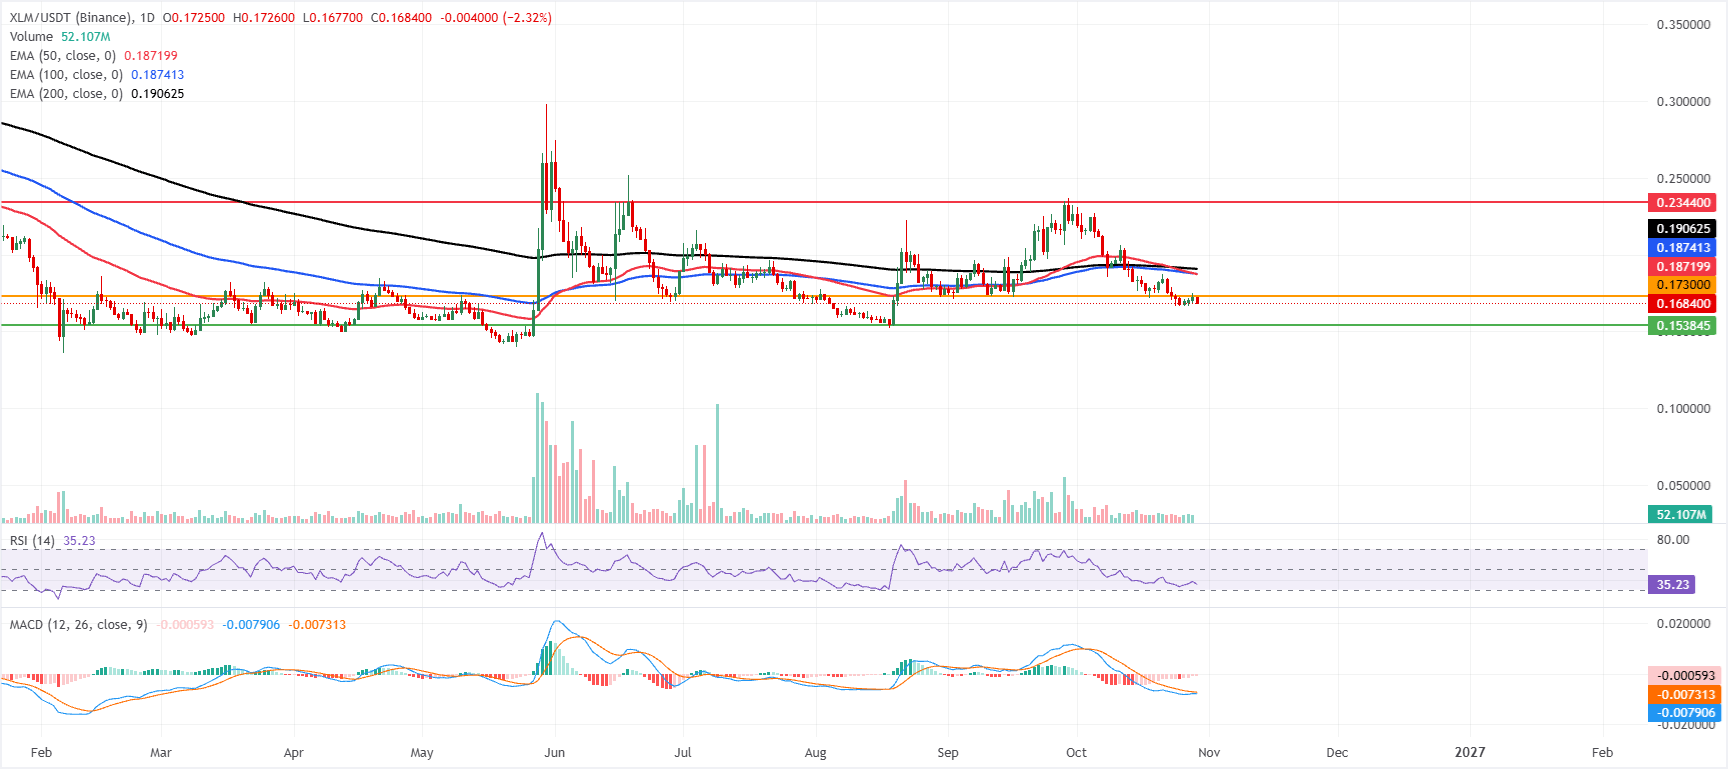
XLM price trades at $0.168 on Thursday, extending a bearish near-term tone as it holds beneath the key EMAs. The 50-day and 100-day EMAs at around $0.187, along with the 200-day EMA at $0.190, all sit overhead, suggesting the broader trend remains capped despite the pair stabilizing off recent lows.
Momentum is weak, with the RSI hovering near 35 and the MACD line still in negative territory, suggesting selling pressure remains dominant even as volatility cools.
On the topside, initial resistance emerges at the horizontal barrier around $0.173, followed by a dense EMA cluster between $0.187 and $0.190 that is likely to limit recovery attempts. A stronger bullish extension would face a more distant obstacle at $0.234, the next notable horizontal resistance.
On the downside, immediate support is seen at $0.153; a decisive break below this floor would open the door to a deeper pullback, while holding above it may allow XLM to consolidate before attempting another test of the $0.173 area.
(The technical analysis of this story was written with the help of an AI tool. Know more.)
บทความแนะนำ


