


Cardano Price Forecast: ADA extends bearish reversal as sell-side pressure intensifies
- Cardano is down over 4% on Thursday, extending losses below $0.2000 after breaking below a rising trendline.
- Derivatives data suggests sell-side dominance as long liquidations surge, Open Interest declines, and funding rate flips negative.
- The technical outlook for ADA suggests a bearish bias as downside momentum gains traction.
Cardano (ADA) faces intense selling pressure, with over 4% losses so far on Thursday, pushing the price below $0.2000. The sell-off aligns with the broader cryptocurrency market pullback after the US Federal Reserve (Fed) decided to pause the federal funds rate at 3.75%-4.00% on Wednesday. The derivatives market sees sell-side dominance among traders amid a bullish positional wipeout and a negative funding rate. Cardano threatens a deeper pullback if sellers push the price below the $0.1894 support set by the August 30 low.
Retail activity flips bearish on Cardano
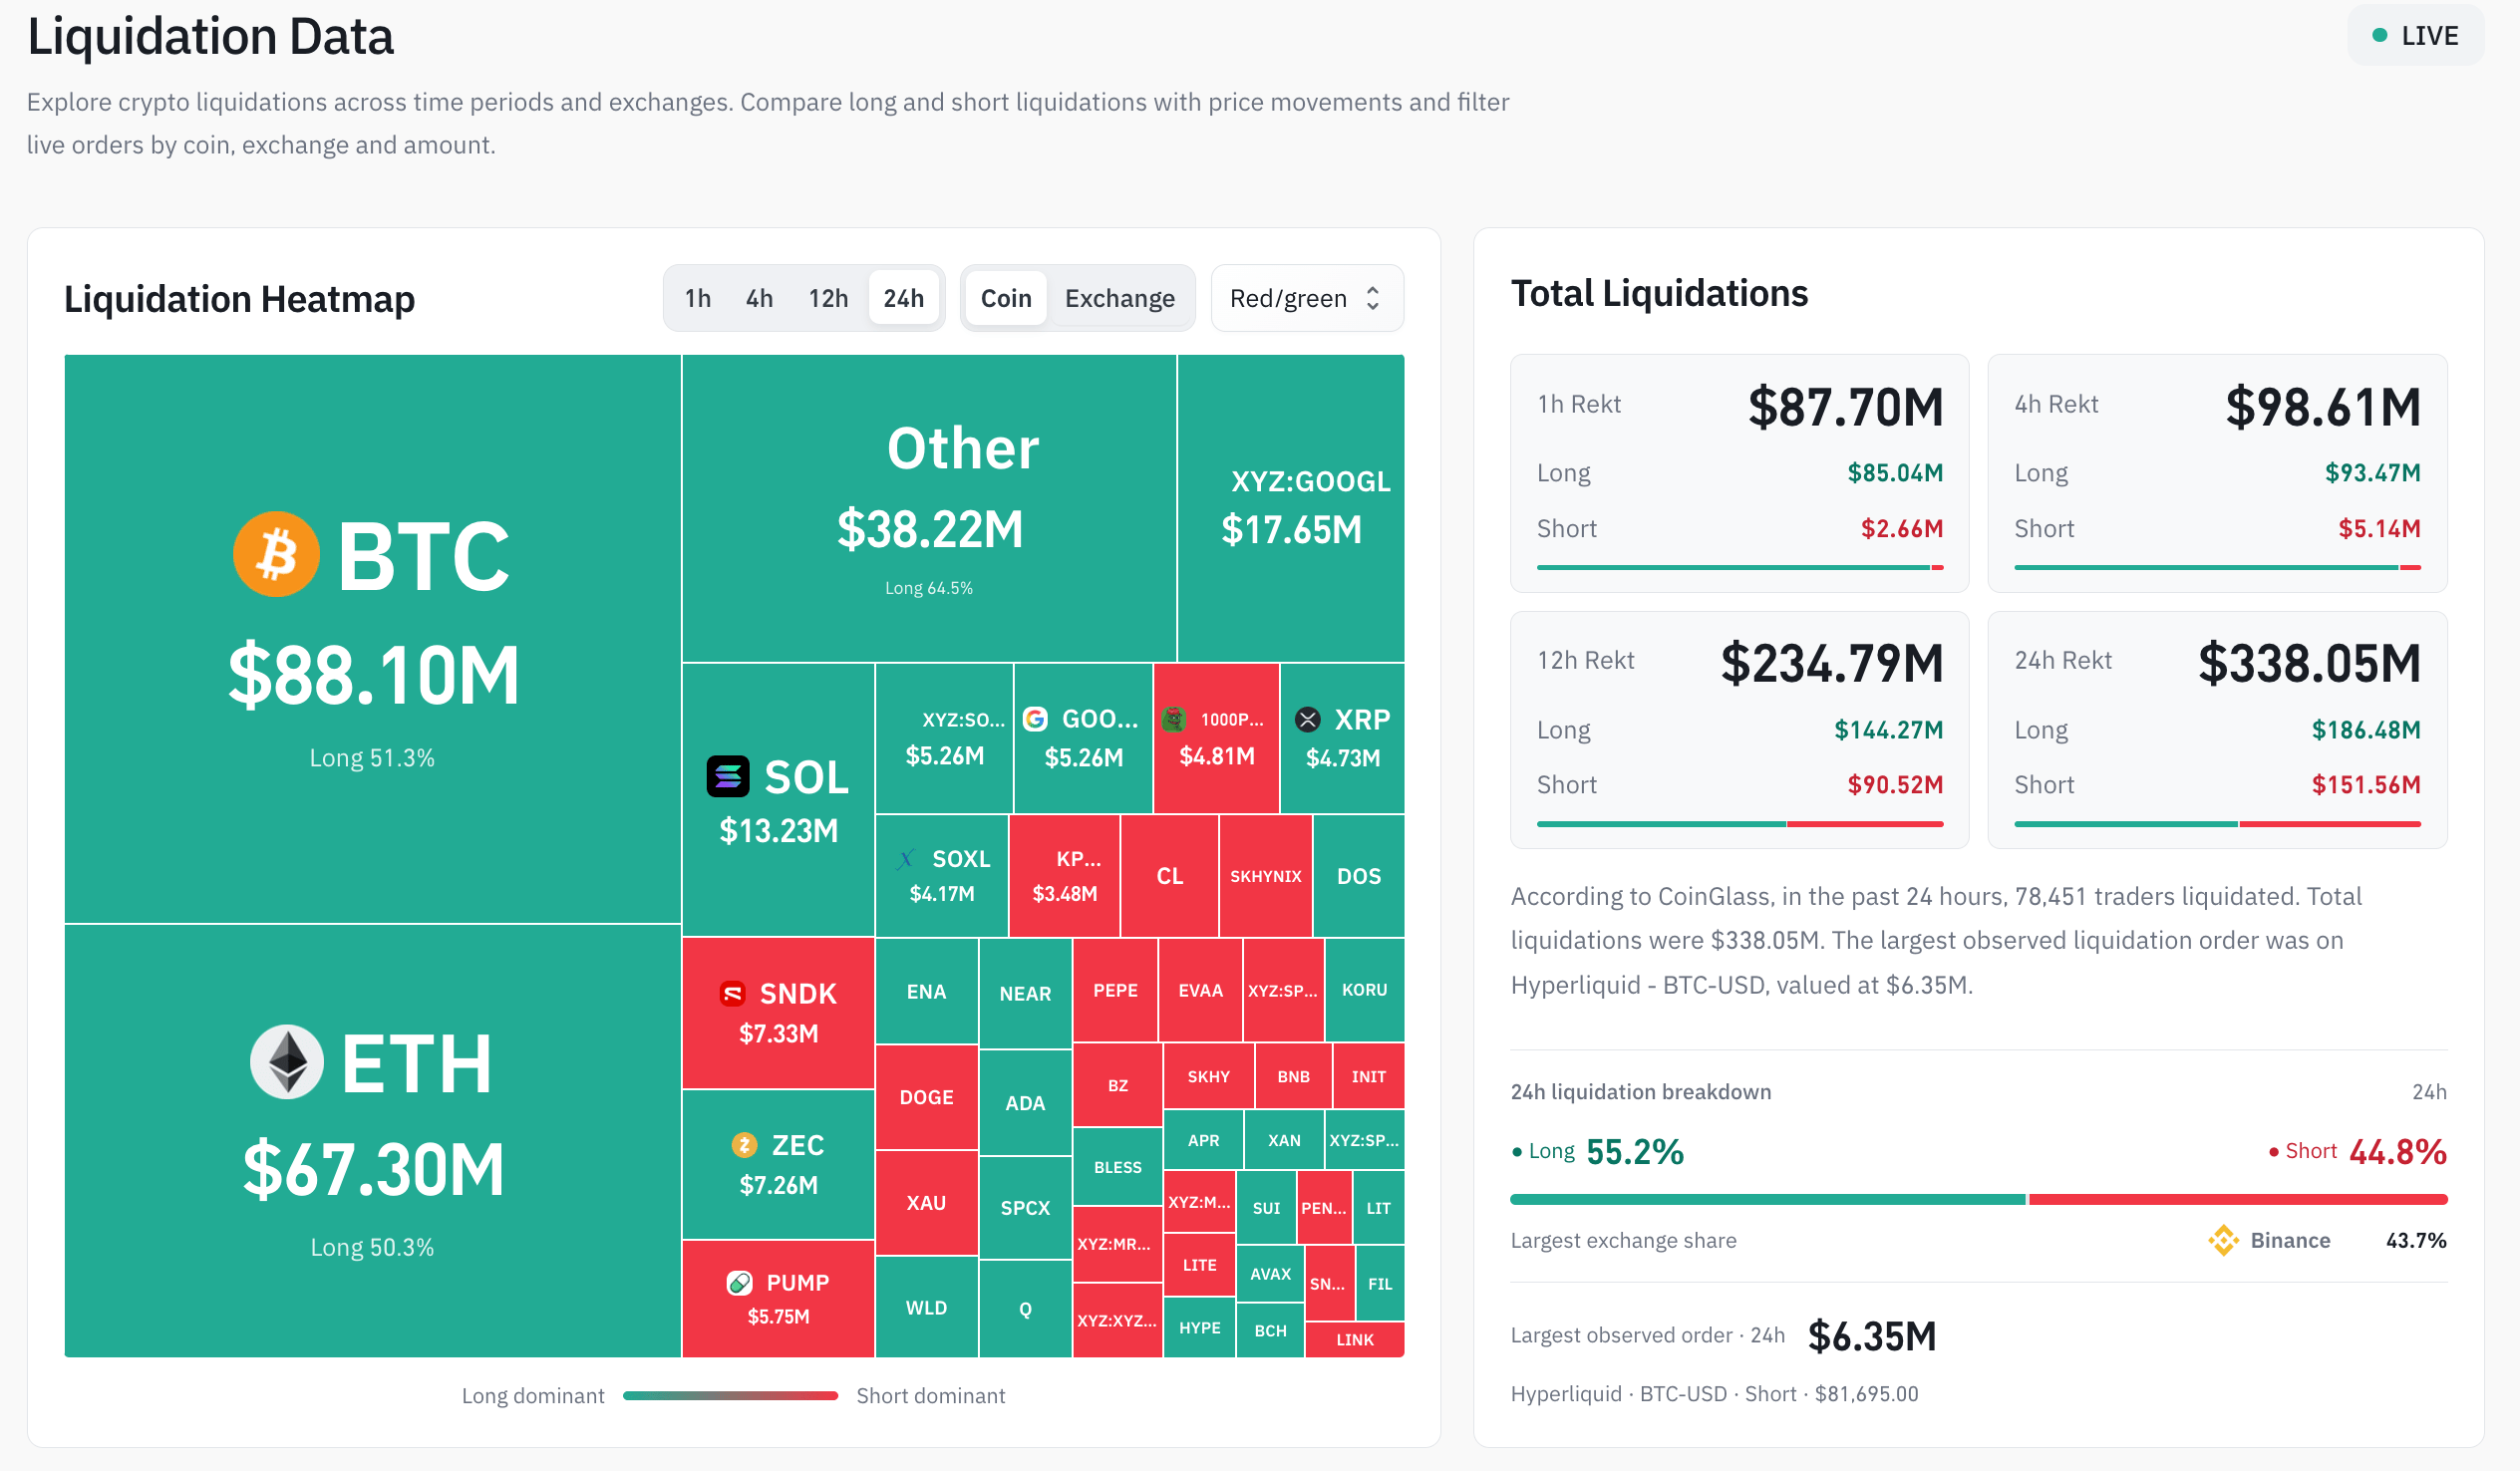
Cardano is losing its retail strength, similar to the broader cryptocurrency market. CoinGlass data shows $338 million in total liquidations over the last 24 hours, led by $186 million in long liquidations, indicating that long-side positions are being forced out. This selling pressure aligns with market leaders, with Bitcoin (BTC) crossing below $80,000 and Ethereum (ETH) dropping below $2,300.
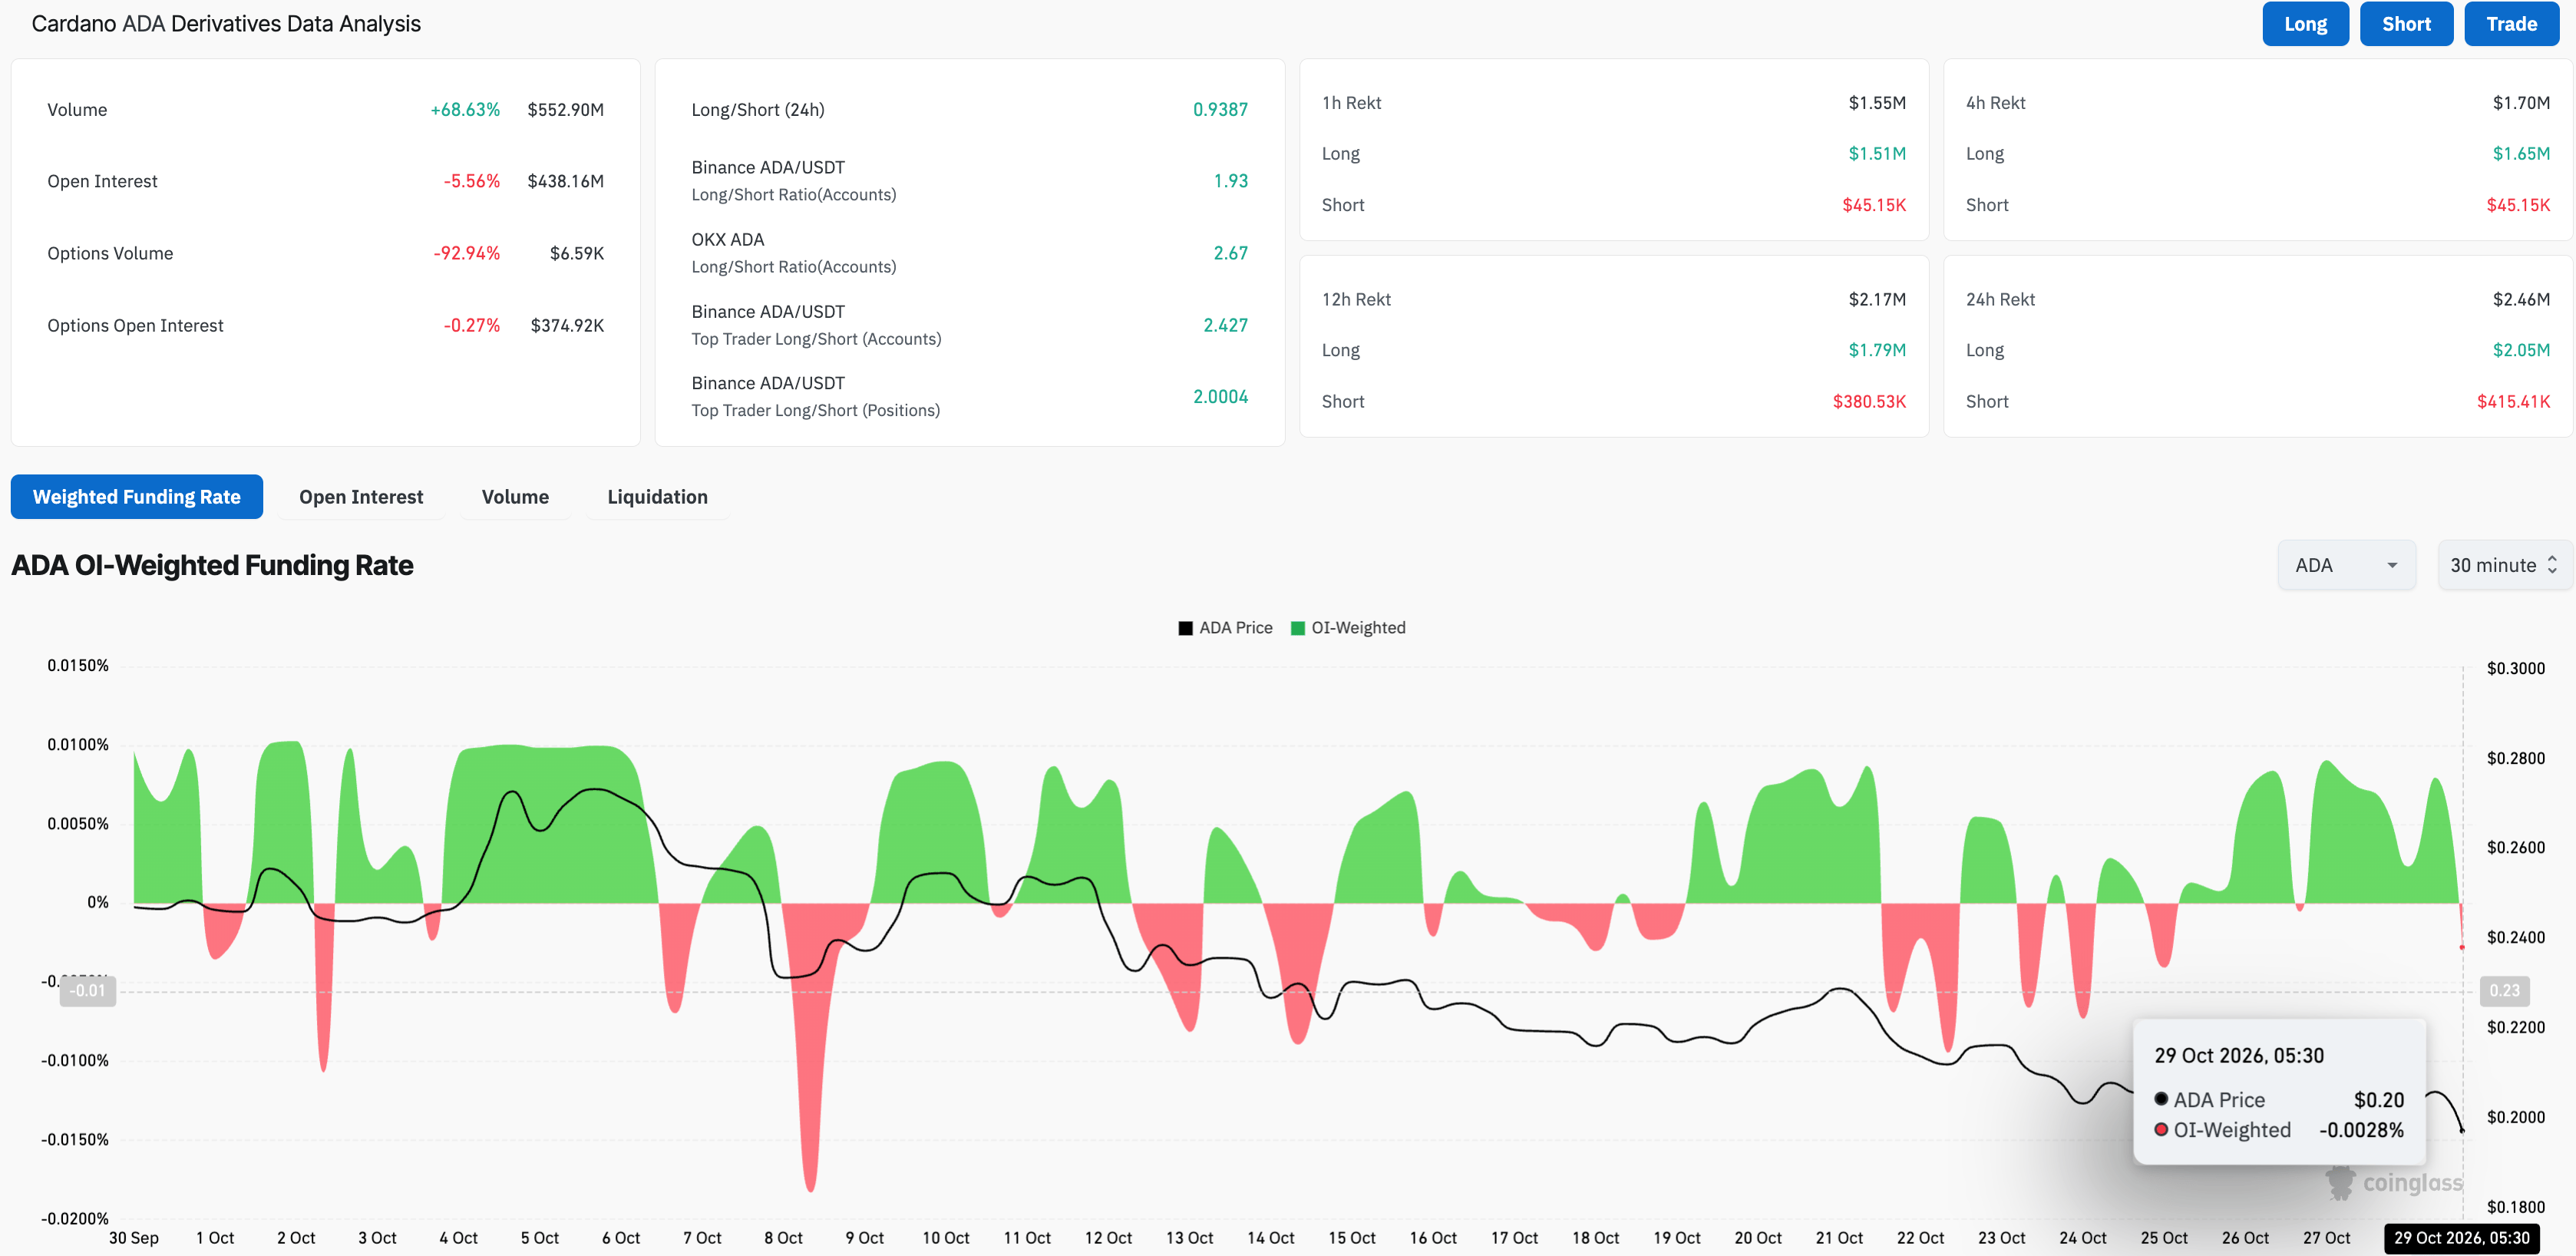
In Cardano’s case, the ADA futures Open Interest (OI) is down by over 5% in the last 24 hours to $438.16 million, indicating that the notional value of all active positions has declined. In addition, the total liquidations of $2.46 million over the same period, led by $2.05 million in long liquidations, suggest that sellers are in control and that bullish positions are being wiped out.
At the same time, the funding rate drops to -0.0028%, indicating that traders are willing to take short positions, anticipating further downside.
Technical outlook: Cardano under stress threatens multiple support bands
Cardano trades at $0.1970 at press time on Thursday, extending a decline of roughly 25% so far in October. ADA price sits well under the 50-day Exponential Moving Average (EMA) at $0.2223 and the 200-day EMA at $0.2407, suggesting the broader trend remains capped.
From a technical perspective, ADA price confirmed a bearish reversal with roughly a 6% decline on October 22, breaking below the rising support trendline connecting the June 25 and August 18 lows, near $0.2223. The immediate support for ADA aligns with the $0.1894 horizontal level set by the August 30 low. A confirmed breakout below this zone could threaten the August 18 and July 28 lows near $0.1712 and $0.1537, respectively.
Momentum indicators reinforce the negative tone, as the Relative Strength Index (RSI) hovers near oversold territory at 32, while the Moving Average Convergence Divergence (MACD) line remains below the signal line with negative histogram readings, hinting at persistent downside pressure.
On the topside, initial resistance is seen at the former trendline-break level of $0.2223, reinforced by the 50-day EMA at the same level. A sustained recovery above these levels would be needed to ease bearish pressure before the more significant 200-day EMA at $0.2408 comes into view as a higher barrier.
(The technical analysis of this story was written with the help of an AI tool. Know more.)
บทความแนะนำ


