

Zcash Price Forecast: ZEC poses 20% downside risk amid steady ETF outflows

แหล่งที่มา Fxstreet
  • Zcash is down 6% so far on Thursday, extending a 2% decline from the previous day.
  • Grayscale’s ZEC-focused ETF recorded $8.49 million in outflows on Wednesday, totaling over $12 million so far this week.
  • The technical outlook for ZEC indicates a downside bias, with near-term momentum shifting bearish.

Zcash (ZEC) price is trading below $1,300 on Thursday, continuing a steady decline over the past 10 days and slipping from its $1,698 peak on September 27. Grayscale’s ZEC Exchange-Traded Fund (ETF) continues to record consistent outflows, with $8.49 million on Wednesday, suggesting reduced demand following the recent stock split. The technical outlook for ZEC is bearish, with bears focused on a break below the 200-period Exponential Moving Average (EMA) on the 4-hour chart around $1,287.

Institutional demand eases after stock split

Grayscale’s Zcash-focused ETF (ZCSH) is experiencing persistent selling pressure, driven by investor redemptions last week following the 3-for-1 stock split. SoSoValue data shows $8.49 million in outflows on Wednesday, bringing the week's total to $12.05 million, up from $93.56 million last week. 

On the other hand, a fresh ZEC-focused ETF filing has been submitted by Cameron and Tyler Winklevoss, 13 years after their Bitcoin ETF filing in 2013. This suggests a long-term constructive outlook for the privacy coin from industry pioneers. Still, the short-term outflows weigh on the spot market, risking further corrective moves.
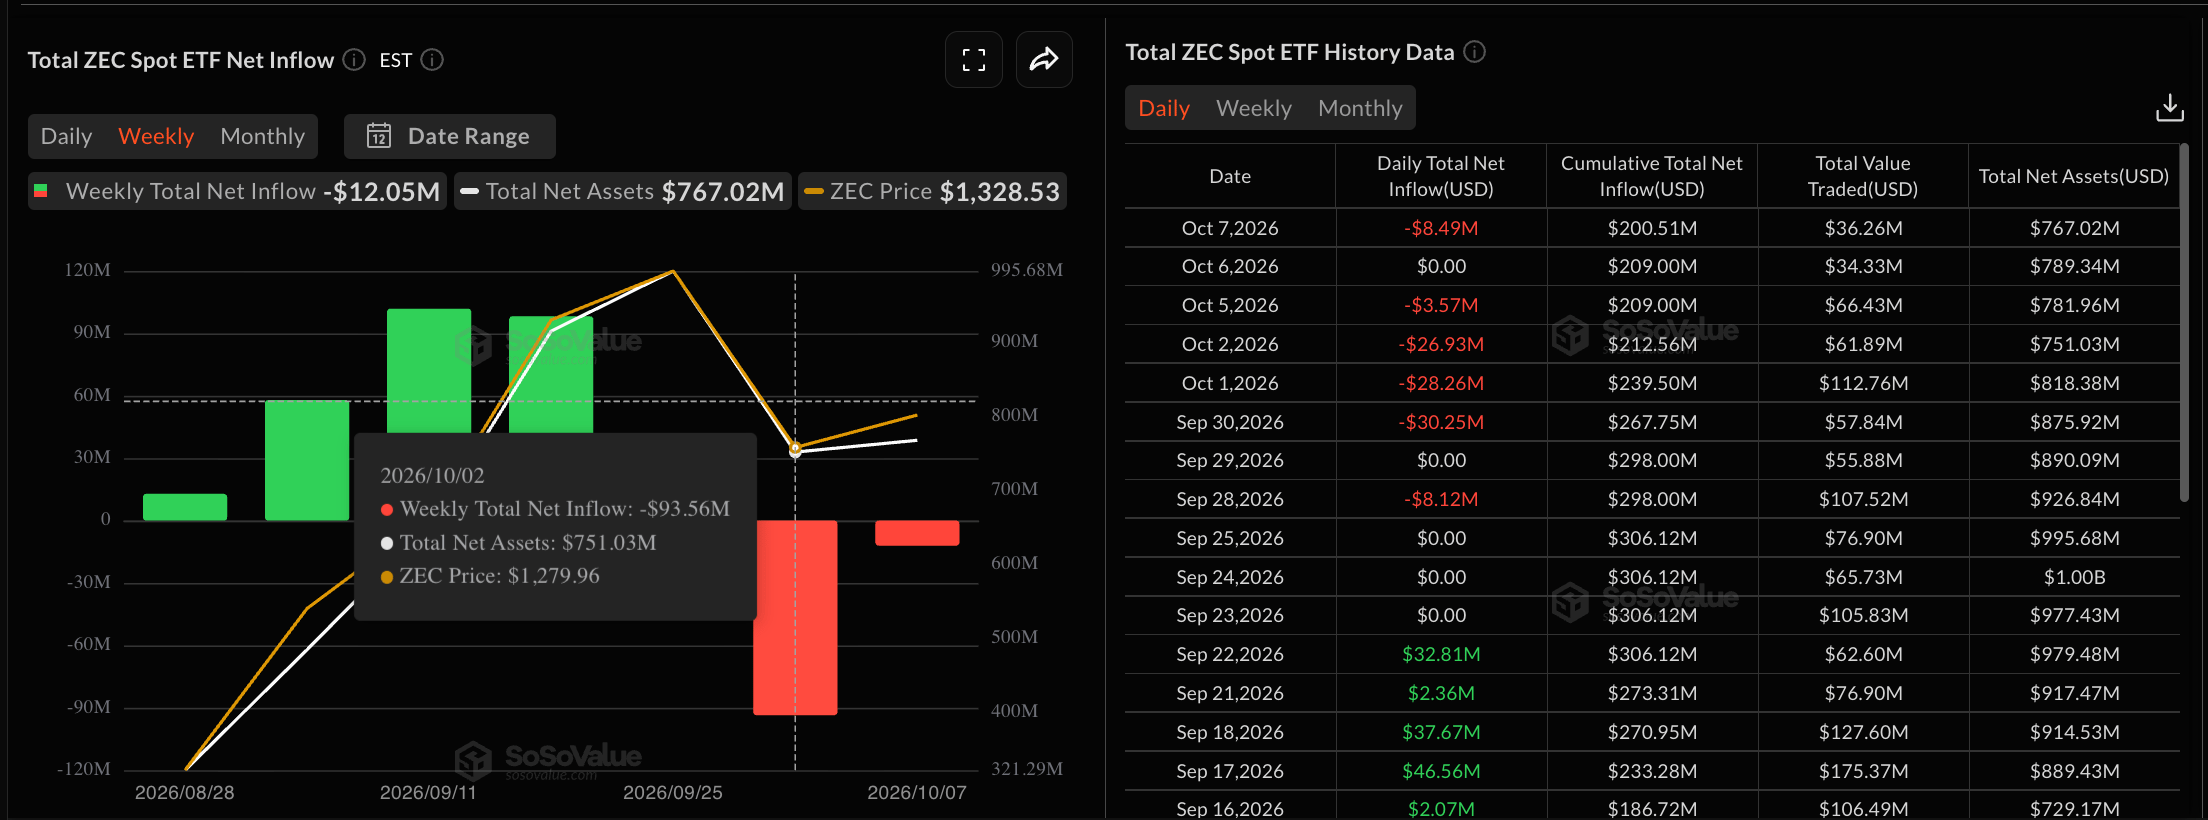
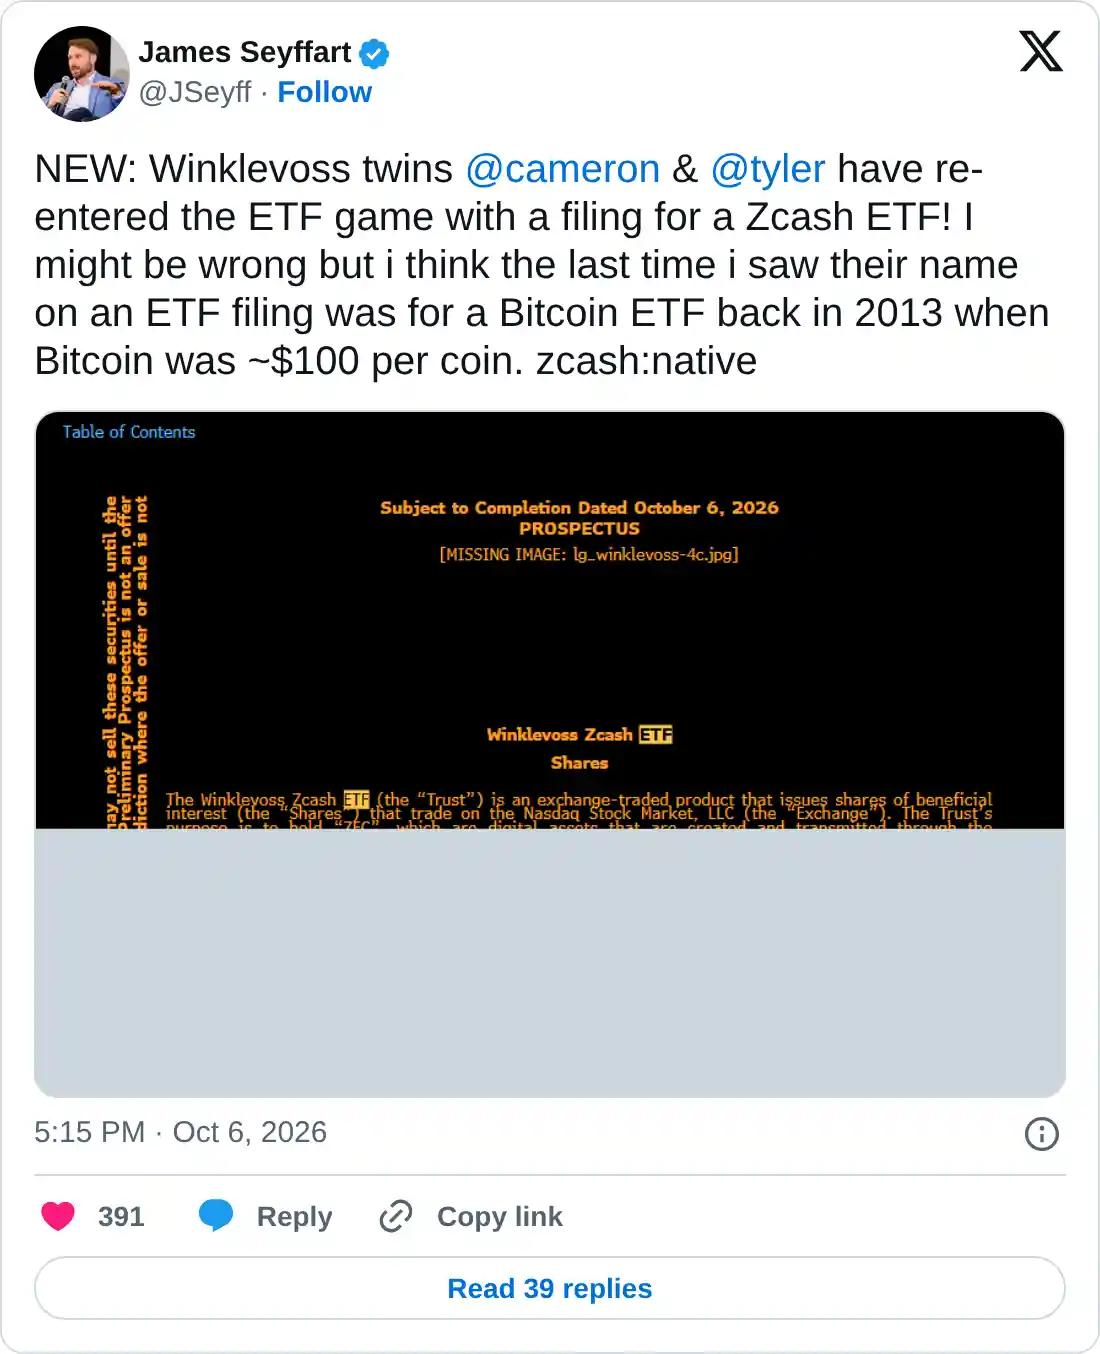
Zcash ETFs data. Source: Sosovalue

https://x.com/JSeyff/status/2107520177739117010

Technical outlook: Zcash risks a drop to $1,050

Zcash trades around $1,246 at press time on Thursday, maintaining a bearish near-term bias. The privacy token is trading below its 200-period EMA at $1,287 on the 4-hour chart, while the declining 50-day EMA risks crossing below the longer-term average, a death cross pattern that would confirm a bearish trend reversal.

Momentum on the 4-hour chart shows a corrective bias, with the Moving Average Convergence Divergence (MACD) crossing below the signal line, while the Relative Strength Index (RSI) near 33 suggests building downside pressure with conditions edging toward oversold rather than a firm base.

From a technical perspective, a decisive sustained breakout below the 200-period EMA at $1,287 could extend the decline toward the $1,050 support level set by the September 4 high. Any deeper pullbacks could risk surpassing the $1,000 psychological support level and testing the $888 horizontal level set by the August 23 high.

Chart Analysis ZEC/USDT (Binance)
ZEC/USDT four-hour price chart.

On the topside, initial resistance is located at the 200-period EMA around $1,287, with a stronger cap at the 50-period EMA near $1,355. Zcash must reclaim these levels to ease the current bearish tone.

(The technical analysis of this story was written with the help of an AI tool. Know more.)

ข้อจำกัดความรับผิดชอบ: เพื่อการอ้างอิงเท่านั้น ผลการดำเนินงานในอดีตไม่ได้บ่งบอกถึงผลลัพธ์ในอนาคต
placeholder
คาดการณ์ราคาโลหะเงิน: XAG/USD ขยับลดลงมาใกล้ระดับ 60.60 ดอลลาร์ ขณะที่อัตราผลตอบแทนพันธบัตรสหรัฐฯ ฟื้นตัวราคาโลหะเงิน (XAGUSD) ปรับตัวลดลงเล็กน้อยมาอยู่ใกล้ $60.60 ในช่วงตลาดลงทุนยุโรปวันพุธ โลหะเงินเผชิญแรงขายเล็กน้อย เนื่องจากอัตราผลตอบแทนพันธบัตรรัฐบาลสหรัฐฯ (US) กลับมาฟื้นตัวหลังจากปรับฐานในวันก่อนหน้า
ผู้เขียน  FXStreet
เมื่อวาน 08: 38
ราคาโลหะเงิน (XAGUSD) ปรับตัวลดลงเล็กน้อยมาอยู่ใกล้ $60.60 ในช่วงตลาดลงทุนยุโรปวันพุธ โลหะเงินเผชิญแรงขายเล็กน้อย เนื่องจากอัตราผลตอบแทนพันธบัตรรัฐบาลสหรัฐฯ (US) กลับมาฟื้นตัวหลังจากปรับฐานในวันก่อนหน้า
placeholder
คาดการณ์ราคาโลหะเงิน: XAG/USD รีบาวด์ขึ้นมาใกล้ระดับ $60.50 แม้อัตราผลตอบแทนพันธบัตรจะพุ่งขึ้นอย่างมากราคาโลหะเงิน (XAG/USD) ปรับตัวขึ้นหลังจากขาดทุนติดต่อกันสองวัน โดยซื้อขายอยู่ที่ระดับประมาณ 60.40 ดอลลาร์ต่อทรอยออนซ์ในช่วงตลาดเอเชียของวันพฤหัสบดี
ผู้เขียน  FXStreet
11 ชั่วโมงที่แล้ว
ราคาโลหะเงิน (XAG/USD) ปรับตัวขึ้นหลังจากขาดทุนติดต่อกันสองวัน โดยซื้อขายอยู่ที่ระดับประมาณ 60.40 ดอลลาร์ต่อทรอยออนซ์ในช่วงตลาดเอเชียของวันพฤหัสบดี
placeholder
ดอลลาร์ออสเตรเลียร่วงลงใกล้ระดับ 0.6950 จากรายงานการประชุมเฟดที่ส่งสัญญาณคุมเข้มนโยบายการเงินในตลาดลงทุนเอเชียวันพฤหัสบดี คู่ AUDUSD ปรับตัวลดลงมาที่ประมาณ 0.6965 ดอลลาร์สหรัฐ (USD) แข็งค่าขึ้นเมื่อเทียบกับดอลลาร์ออสเตรเลีย (AUD) หลังรายงานการประชุมของคณะกรรมการกำหนดนโยบายการเงินของธนาคารกลางสหรัฐฯ (FOMC) แสดงท่าทีเข้มงวด
ผู้เขียน  FXStreet
9 ชั่วโมงที่แล้ว
ในตลาดลงทุนเอเชียวันพฤหัสบดี คู่ AUDUSD ปรับตัวลดลงมาที่ประมาณ 0.6965 ดอลลาร์สหรัฐ (USD) แข็งค่าขึ้นเมื่อเทียบกับดอลลาร์ออสเตรเลีย (AUD) หลังรายงานการประชุมของคณะกรรมการกำหนดนโยบายการเงินของธนาคารกลางสหรัฐฯ (FOMC) แสดงท่าทีเข้มงวด
placeholder
ข่าวหุ้นวันนี้ เฟดส่งสัญญาณจ่อขึ้นดอกเบี้ยอีกรอบ วอลล์สตรีทสะดุดหลุดนิวไฮ ทองโลกย่อตัวหลุด $4,200 ขณะ SET แกว่งแคบทันทุกกระแสการเงิน สรุปข่าวเด่น Forex หุ้น ทองคำ คริปโตฯ และเศรษฐกิจรอบวัน วิเคราะห์แนวโน้มตลาดด้วยข้อมูลเชิงลึก อ่านง่าย เข้าใจไว อัปเดตล่าสุดที่นี่
ผู้เขียน  Mitrade
8 ชั่วโมงที่แล้ว
ทันทุกกระแสการเงิน สรุปข่าวเด่น Forex หุ้น ทองคำ คริปโตฯ และเศรษฐกิจรอบวัน วิเคราะห์แนวโน้มตลาดด้วยข้อมูลเชิงลึก อ่านง่าย เข้าใจไว อัปเดตล่าสุดที่นี่
placeholder
ราคาน้ำมัน WTI พุ่งขึ้นเหนือระดับ $90.00 ขณะที่ความตึงเครียดในตะวันออกกลางทวีความรุนแรงขึ้นในวันพฤหัสบดี น้ำมันดิบซื้อขายสูงขึ้น หลังมีรายงานการโจมตีครั้งใหม่ใส่สนามบินในซาอุดีอาระเบียโดยกองกำลังติดอาวุธฮูตี ราคาน้ำมัน West Texas Intermediate (WTI) ซึ่งเป็นน้ำมันมาตรฐานของสหรัฐฯ กลับมาอยู่เหนือระดับ $90.00 และกำลังเข้าใกล้ระดับสูงสุดในรอบสัปดาห์ที่ $90.87 ณ เวลาที่เขียนข่าว
ผู้เขียน  FXStreet
6 ชั่วโมงที่แล้ว
ในวันพฤหัสบดี น้ำมันดิบซื้อขายสูงขึ้น หลังมีรายงานการโจมตีครั้งใหม่ใส่สนามบินในซาอุดีอาระเบียโดยกองกำลังติดอาวุธฮูตี ราคาน้ำมัน West Texas Intermediate (WTI) ซึ่งเป็นน้ำมันมาตรฐานของสหรัฐฯ กลับมาอยู่เหนือระดับ $90.00 และกำลังเข้าใกล้ระดับสูงสุดในรอบสัปดาห์ที่ $90.87 ณ เวลาที่เขียนข่าว
goTop
quote