


Quant Price Prediction 2026-2032: Is QNT a Good Investment?
Key Takeaways
- Quant price faces volatility around $250.
- Our Quant price prediction expects the QNT price to record a maximum level of $430 in 2026.
- In 2032, we expect the QNT price to achieve $2291.68.
Following the return of Donald Trump to the White House and his crypto-friendly behavior, altcoins have gained momentum.
Should the crypto market undergo a bullish reversal, the demand for Quant (QNT) could surge, potentially pushing its price beyond $100.
Meanwhile, at the resistance levels of $100 and $90, bullish investors might find attractive opportunities. This price prediction for Quant examines the project’s utility, tokenomics, and market trends, providing a forecast for its price from 2026 to 2032.
Overview
| Cryptocurrency | Quant |
| Token | QNT |
| Price | $90 |
| Market Cap | $3B |
| Trading Volume | $429.07M |
| Circulating Supply | 12.07M QNT |
| All-time High | $428 |
| All-time Low | $0.16 |
Quant Technical Analysis
| Metric | Value |
| Current Price | $ 249.29 |
| Price Prediction | $ 271.09 (8.87%) |
| Fear & Greed Index | 72 (Greed) |
| Sentiment | Neutral |
| Volatility | 70.66% (Extremely High) |
| Green Days | 18/30 (60%) |
| 50-Day SMA | $ 86.18 |
| 200-Day SMA | $ 73.73 |
| 14-Day RSI | 69.88 (Neutral) |
QNT Price Analysis
Quant price faces bearish pressure toward $235
- QNT price analysis shows a bearish pattern as it hovers around $235.
- Resistance for Quant is present at $272.06
- Support for QNT/USD is present at $223.47
The QNT price analysis for 2 October confirms that Quant witnessed bearish pressure as it faced increased selling activity. The price is currently aiming for a hold above $230.
Quant price analysis 1-day chart: QNT price attempts to meet sellers’ demand
Analyzing the daily price chart of QNT tokens, Quant’s price witnessed a bearish correction after bears pushed the price below immediate Fib lines. Over the last 24 hours, Quant price has been on a solid bearish path as it holds above $90. The 24-hour volume declined to $83 million, showing a decreased interest in trading activity today. Quant price is currently trading at $235, declining by over 10% in the last 24 hours.
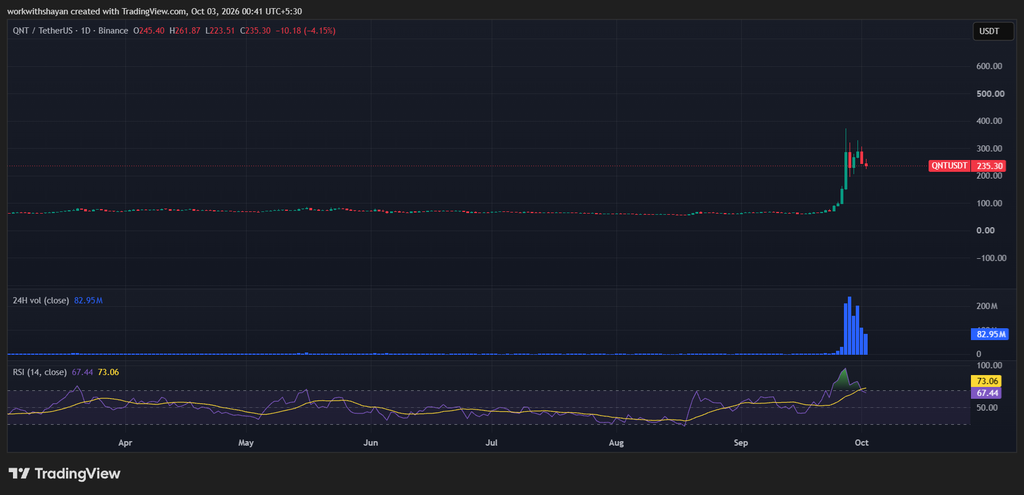
The RSI-14 trend line has surged from its previous level and currently hovers around 67-level, showing that bulls are slowly gaining the momentum of the price. The SMA-14 level suggests upward volatility in the next few hours.
Quant/USDT 4-hour price chart: Bearish dominance surges around EMA trendlines
The 4-hour Quant price chart suggests QNT continues to experience bullish activity near EMA lines, creating a positive sentiment on the price chart. As the price continues to hold above EMA lines, bulls are aiming for a break above the EMA20 trend line.
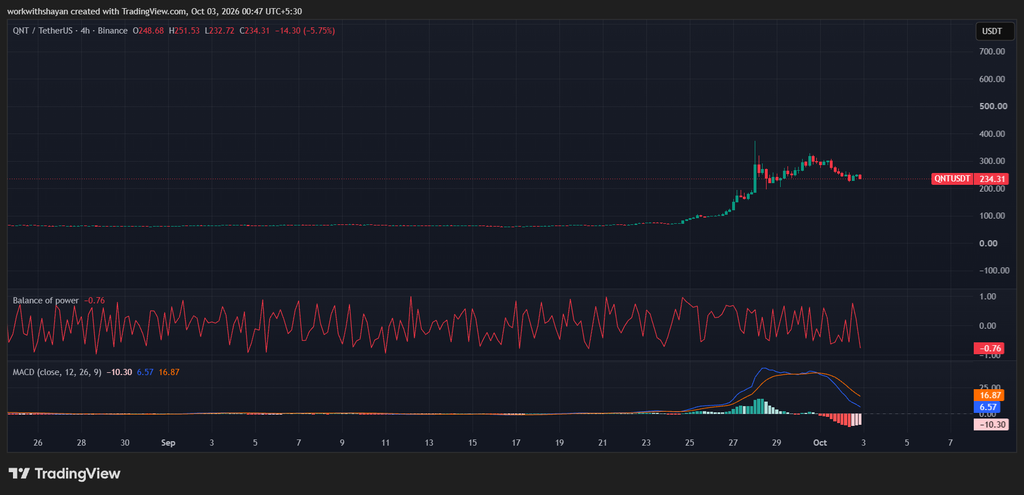
The BoP indicator is trading in a bearish region at 0.76, hinting that sellers are trying to build pressure near resistance levels and boost a downward correction.
Additionally, the MACD trend line has formed red candles below the signal line and the indicator aims for a negative momentum, strengthening bearish positions.
Quant Price Predictions: Levels And Action
Daily Simple Moving Average (SMA)
| Period | Value | Action |
| SMA 3 | $ 265.66 | SELL |
| SMA 5 | $ 262.44 | SELL |
| SMA 10 | $ 179.84 | BUY |
| SMA 21 | $ 118.89 | BUY |
| SMA 50 | $ 86.18 | BUY |
| SMA 100 | $ 74.91 | BUY |
| SMA 200 | $ 73.73 | BUY |
Daily Exponential Moving Average (EMA)
| Period | Value | Action |
| EMA 3 | $ 254.06 | SELL |
| EMA 5 | $ 240.03 | BUY |
| EMA 10 | $ 198.58 | BUY |
| EMA 21 | $ 147.65 | BUY |
| EMA 50 | $ 104.69 | BUY |
| EMA 100 | $ 86.21 | BUY |
| EMA 200 | $ 79.12 | BUY |
What to expect from Quant price analysis next?
The hourly price chart confirms bears are making efforts to prevent the Quant price from an immediate surge. However, if the Quant price successfully breaks above $272.06, it may surge higher and touch the resistance at $318.97.
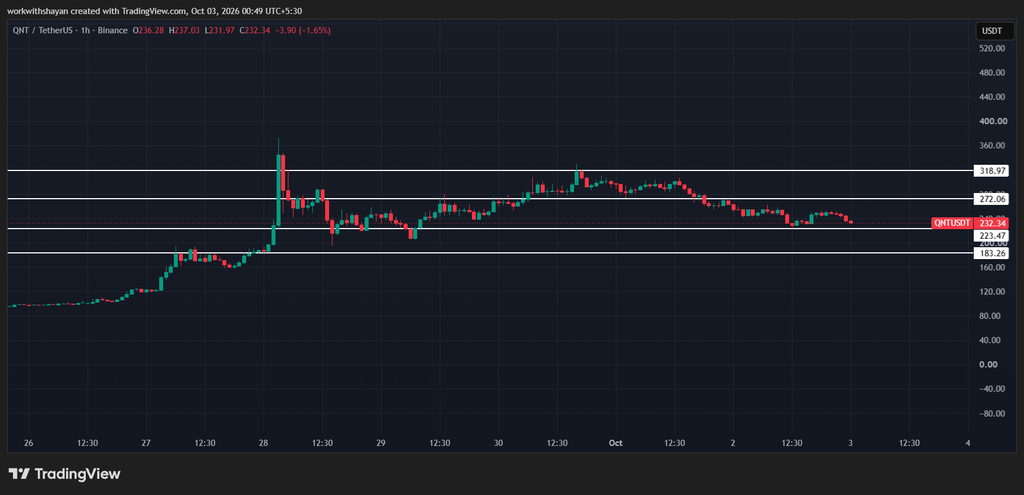
If bulls cannot initiate a surge, Quant price may drop below the immediate support line at $223.47, resulting in a correction to $183.26.
Is Quant a Good Investment?
It’s not straightforward to assess. QNT has shown remarkable resilience, quietly becoming one of the big crypto success stories of 2022—a year many in the sector would prefer to forget, as it consistently outperformed the market.
It’s important to remember that Quant remains vulnerable to market crashes. As QNT price is set to surge further, it can be a good investment option in the long run. As with any cryptocurrency investment, conducting thorough research is crucial before investing in QNT.
Why is the QNT Price Down Today?
QNT price witnessed bearish pressure as buyers failed to hold the price above $250.
Will QNT Price Recover?
If buyers push the price above $250, we might see a strong recovery toward $300.
Will QNT Price Reach $100?
QNT price already touched the $100 mark in 2026. However, the price is now aiming to surge further.
Will QNT Price Reach $1000?
Due to the effort of the community, Quant Coin’s prices will continue to increase, reaching $1000 in the coming years.
Is QNT a Good Long-Term Investment?
QNT has gained popularity thanks to strong community support. However, it’s crucial to conduct thorough research into their long-term potential to determine if it represents a viable long-term investment.
Recent QNT News/Opinions
TCH selected Quant to power interoperability for its On-Chain Money Initiative, with the network expected to launch in H1 2027.
QNT Price Prediction October 2026
Over the last few days, QNT coin price has been on an upward trend and it aims to surge above crucial Fib levels. If the BTC price aims for a recovery above $100K in October, we might see a solid recovery in the QNT price.
According to technical analysis, we might see the QNT price to record the maximum level of $300 and minimum price of $71 with an expected average trading price of $200 throughout October.
| Quant Price Prediction | Potential Low | Potential Average | Potential High |
| Quant Price Prediction October 2026 | $71 | $200 | $300 |
Quant Price Forecast 2026
In 2026, the lowest predicted price of Quant is $50. The price could surge to a high of $430, maintaining an average around $150.
| Quant Price Prediction | Potential Low | Potential Average | Potential High |
| Quant Price Prediction 2026 | 50 | 150 | 430 |
Quant Price Prediction 2027-2032
| Year | Minimum Price ($) | Average Price ($) | Maximum Price ($) |
| 2027 | $318.47 | $376.92 | $459.83 |
| 2028 | $472.61 | $548.37 | $682.14 |
| 2029 | $651.28 | $783.46 | $941.75 |
| 2030 | $884.53 | $1,067.82 | $1,318.64 |
| 2031 | $1,126.79 | $1,394.58 | $1,728.35 |
| 2032 | $1,487.36 | $1,836.74 | $2,291.68 |
Quant (QNT) Price Prediction 2027
By 2027, Quant is anticipated to have a minimum price of $318.47. Its price could climb to a high of $459.83, averaging around $376.92 for the year.
Quant Price Prediction 2028
The forecast for 2028 indicates a minimum price of $472.61 for Quant. The price is expected to reach up to $682.14, with an average of $548.37 throughout the year.
Quant Price Prediction 2029
Our analysis suggests that in 2029, Quant will have a minimum price of $651.28. It could reach a high of $941.75, with an average price of $783.46.
Quant (QNT) Price Prediction 2030
Based on technical analysis of past data, Quant is expected to reach a minimum price of $884.53 in 2030. The maximum price could be $1,318.64, with an average of $1,067.82.
Quant (QNT) Price Prediction 2031
Based on technical analysis of past data, Quant is expected to reach a minimum price of $1,126.79 in 2031. The maximum price could be $1,728.35, with an average of $1,394.58.
Quant (QNT) Price Prediction 2032
In 2032, Quant could record a minimum price of $1,487.36. The price may climb to a maximum of $2,291.68, while the average price is expected to remain around $1,836.74 for the year.

Quant Market Price Prediction: Analysts’ QNT Price Forecast
| Firm Name | 2026 | 2027 |
| Coincodex | 400 | 480 |
| DigitalCoinPrice | 360 | 569 |
Cryptopolitan’s Quant Price Prediction
At Cryptopolitan, we are bullish on the Quant price movements as the coin is expected to surge to new highs by the end of this year. In 2026, the lowest predicted price of Quant is $50. The price could surge to a high of $430, maintaining an average around $150.
Quant Historical Price Sentiment
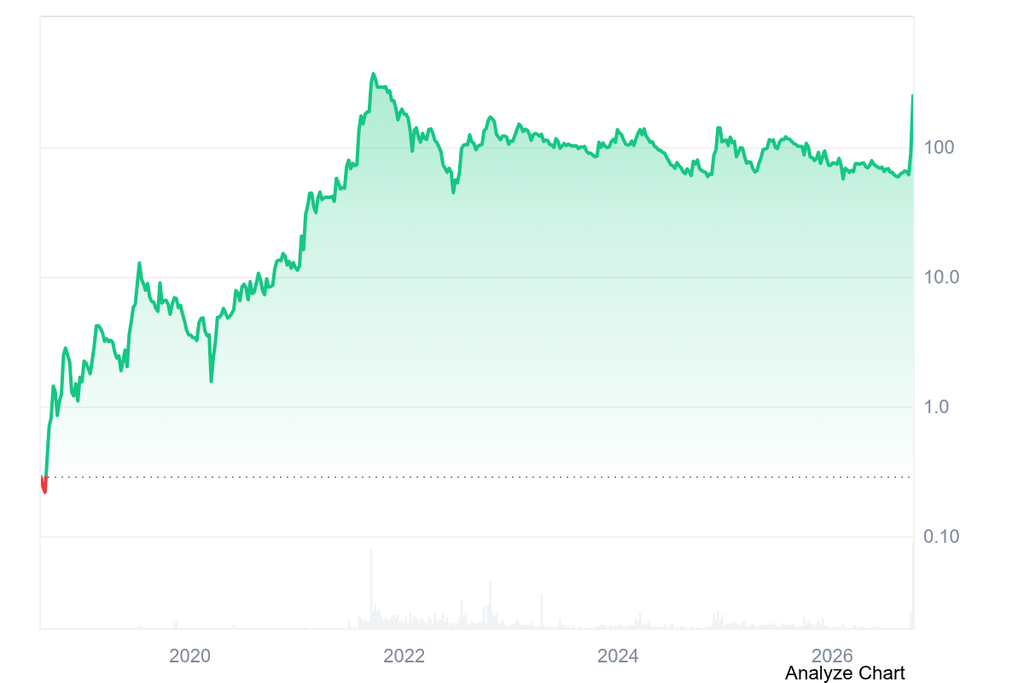
- September, 2026: The price of QNT skyrocketed toward $350.
- September, 2025: QNT price further declined toward the low of $85
- February, 2025: Quant price dropped below the crucial $100 mark.
- December, 2024: Quant price skyrocketed toward $165.
- October, 2024: Quant declined below $60.
- July 1, 2024: Quant was priced at $79.2950.
- June 8, 2024: The price of Quant stood at $85.2069.
- April 8, 2024: Quant was trading at $120.22.
- One year ago: The price was recorded at $102.5174.
- Launch price (August 11, 2018): Quant debuted at $0.2524.
บทความแนะนำ


