

Bullish Engulfing Pattern: Definition, Importance, Usage & Examples
The Bullish Engulfing Candlestick Pattern is a popular technical analysis tool that provides valuable insights into potential market reversals and trend shifts. This article delves into the significance of this pattern, its application in real-life examples, and the pros and cons associated with its usage.
1. What is a Bullish Engulfing Candlestick?
1.1. Definition of the Bullish Engulfing Candlestick pattern
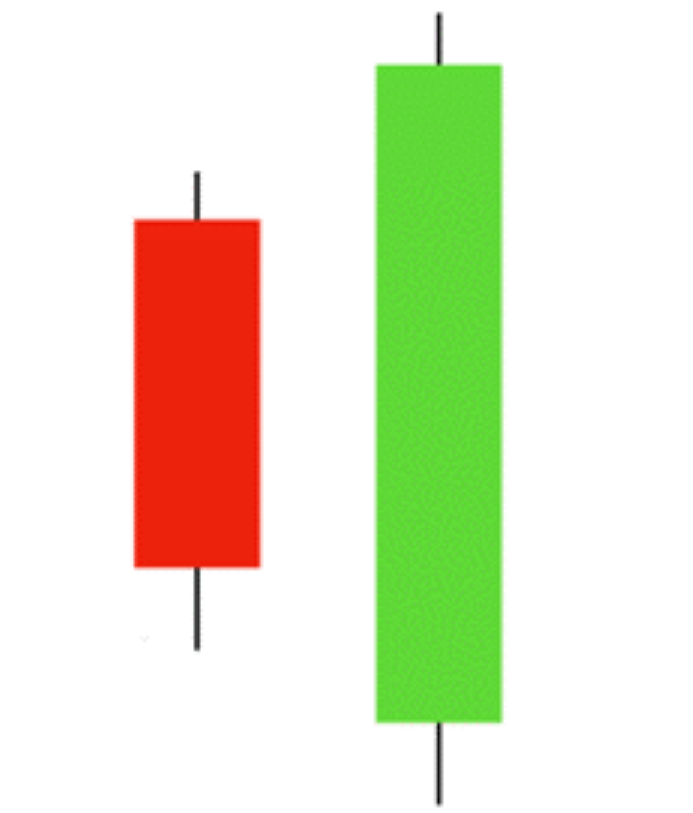
A Bullish Engulfing Candlestick is a significant pattern in technical analysis that signals a potential reversal from a bearish to a bullish market trend. It is identified by a large white or green candlestick that follows a smaller black or red candlestick, with the body of the white candlestick fully engulfing the body of the previous day's black candlestick.
This pattern typically occurs at the end of a downtrend, indicating that buying pressure has overcome selling pressure, suggesting a shift in market sentiment from bearish to bullish.

(source: Investopedia)
1.2. Importance and relevance of the pattern in technical analysis
The Bullish Engulfing Candlestick pattern holds significant importance as it serves as a signal to traders about a potential change in trend, enabling them to make informed decisions regarding entering long positions. When this pattern follows a clear downward price movement, it effectively demonstrates a shift in momentum towards the upside.
Traders often seek confirmation of the trend reversal through additional indicators or subsequent price movements surpassing the high of the engulfing candle before committing to a trade. The pattern's reliability is further enhanced when accompanied by high trading volume, indicating strong buyer commitment. Like other technical analysis tools, its effectiveness is maximized when used in conjunction with other indicators and analysis techniques to confirm the signal's strength and the potential for a sustained upward trend.
The relevance of the Bullish Engulfing pattern lies in its ability to provide early signals of a changing trend, allowing traders to position themselves accordingly. The Bullish Engulfing pattern's importance is underscored by its widespread recognition and usage among traders, highlighting its role as a key component in the decision-making process within financial markets.
2. Formation of the Bullish Engulfing Candlestick Pattern
2.1. How the pattern is formed
The Bullish Engulfing Candlestick pattern is composed of two candlesticks: a smaller bearish candle followed by a larger bullish candle. This pattern typically occurs during a downtrend. The smaller candlestick, represented by a black or red color, signifies a closing price lower than the opening price.
It is then followed by a larger white or green candlestick, indicating a closing price higher than the opening price. The larger candlestick completely engulfs the body of the previous day's candle. This signifies a strong buying pressure that surpasses the selling pressure, suggesting a shift in market sentiment.
The second candlestick must engulf the body of the first, meaning the bullish candle's open is lower than the bearish candle's close, and the bullish candle's close is higher than the bearish candle's open.
This pattern suggests that the selling pressure of the first day is overcome by strong buying pressure, driving the price up to finish above the previous day's open. It is a sign that buyers have taken control of the market and that the sentiment may be shifting. For traders, the Bullish Engulfing Pattern is a cue to consider long positions, especially when it is accompanied by high trading volume, which further confirms the change in momentum.
2.2. Description of the two candlesticks involved in the pattern

The first candlestick in the pattern typically has a small real body, representing a narrow price range between the open and close, and can be either red or green.
The second candlestick, known as the engulfing candlestick, must have a green real body that extends well above and below the body of the first candlestick. This pattern is widely regarded as a reliable indicator that the bulls have gained control of the market. Traders commonly use it to identify potential entry points for long positions.


3. Interpretation and Significance of the Bullish Engulfing Candlestick Pattern
3.1. What does the pattern indicate?
The Bullish Engulfing Candlestick Pattern is significant as it indicates a strong buying pressure surpassing prior selling pressure, suggesting that the bears may be losing control and a reversal in trend could be imminent.
Traders interpret this pattern as a signal of a shift in market sentiment, with the bulls gaining control and a possible upward price movement. It is particularly noteworthy when it appears at the end of a downtrend, potentially signaling the exhaustion of bearish momentum and the start of a bullish phase.
However, it is important to note that the Bullish Engulfing Pattern should not be relied upon in isolation. Traders typically seek confirmation from other indicators and market factors before making trading decisions. The pattern's reliability increases when accompanied by high trading volume, indicating strong conviction behind the price movement.
3.2. Understanding the implications for market sentiment and potential trend reversal
Moreover, the context in which the pattern forms is crucial, and it carries more weight when aligned with other supportive technical elements such as support levels, moving averages, or momentum oscillators.
In essence, the Bullish Engulfing Candlestick Pattern serves as a guide for traders, highlighting potential market turning points and offering insight into the collective psychology of market participants.
Proper interpretation of the pattern requires a nuanced understanding of market dynamics and should be integrated into a comprehensive trading strategy for optimal results.
4. Recognizing and Identifying the Bullish Engulfing Candlestick Pattern
Key characteristics of the Bullish Engulfing Candlestick Pattern include a preceding downtrend, a bearish candlestick followed by a larger bullish candlestick, and the bullish candlestick opening at or below the previous day's close but closing above the previous day's open.
The pattern indicates strong buying pressure, as buyers are willing to enter the market at higher prices, overpowering the sellers. It is often considered more significant if the engulfing candle's high and low range is larger than that of the previous candles, and it is typically confirmed by an increase in trading volume.
For example, a Bullish Engulfing Candlestick Pattern can be observed in the AUD/USD chart.

Source: Mitrade
However, it is crucial to consider additional factors before making trading decisions. Trend analysis provides context, indicating whether the pattern aligns with a broader bullish trend. Support and resistance levels offer insight into potential price barriers, while technical indicators such as moving averages and volume can confirm the strength of the reversal.
Traders may use this pattern as a signal to consider long positions, but it is important to remember that additional confirmation from other indicators can enhance its reliability. By considering these elements, traders can make more informed decisions when the Bullish Engulfing Pattern emerges on the charts.
5. Trading Strategies and Application of the Bullish Engulfing Candlestick Pattern
The Bullish Engulfing Candlestick Pattern is a powerful tool in the arsenal of trading strategies, offering clear insights into potential market reversals. Here's how to effectively apply this pattern:
5.1. Determining Entry Points:
– Identify the pattern when a smaller bearish candle is followed by a larger bullish candle that completely engulfs the previous day's price range.
– Consider an entry point when the price of the asset moves above the high of the engulfing candle, indicating a potential upward trend.
5.2. Setting Stop-Loss and Profit Target Levels:
– Place a stop-loss just below the low of the engulfing candle to limit potential losses if the market moves against the trade.
– Set profit targets at predetermined price levels or percentage gains, or use resistance levels identified through historical price analysis.
5.3. Incorporating Other Technical Analysis Tools:
– Use additional indicators such as moving averages, RSI, or MACD to confirm the bullish signal.
– Volume analysis can also provide confirmation; an increase in volume during the formation of the engulfing candle suggests stronger buyer commitment.
5.4. Tips to Improve Accuracy and Reliability:
– Wait for additional confirmation signals after the engulfing pattern before entering a trade to avoid false positives.
– Study the past performance of the pattern in the context of the specific asset being traded, as some patterns may work better in certain markets.
– Stay informed about news and events that may impact market sentiment, as technical patterns can be influenced by external factors.
By carefully applying these points, traders can enhance their use of the Bullish Engulfing Candlestick Pattern, making it a more reliable component of their trading strategy. However, it's important to remember that no pattern guarantees success, and it's crucial to combine technical analysis with sound risk management practices.
6. An Example and Case Study of the Bullish Engulfing Candlestick Pattern
To illustrate the occurrence and implications of the Bullish Engulfing Candlestick Pattern, let's consider a real-life example using a 30-minute chart of Bitcoin (BTC).

(Source: Mitrade)
On April 19, 2024, BTC's price was at the end of a downtrend, with a price of $59,600 per BTC at 9:00. At 9:30, a classic Bullish Engulfing Pattern formed, with a price of $61,284 per BTC. This pattern served as a precursor to a significant upward price movement.
This example demonstrates how the pattern appeared after a downtrend, indicating a potential reversal and subsequent price increase. Traders who recognized this pattern could have used it as a signal to enter long positions or adjust their trading strategies accordingly.
7. Pros and Cons of the Bullish Engulfing Candlestick Pattern
While the Bullish Engulfing Candlestick Pattern can be a valuable tool for traders, it is essential to consider its pros and cons and use it in conjunction with other analysis methods. Here is a detailed look at its advantages and disadvantages:
Pros | Cons |
|
|
8. FAQs about Bullish Engulfing Candlestick Pattern
8.1. Is Bullish Engulfing Candlestick profitable?
Yes, the Bullish Engulfing Candlestick Pattern can potentially be profitable when used in conjunction with other technical analysis tools and risk management strategies. However, it is important to note that no trading pattern guarantees profits, and individual results may vary. Traders often seek confirmation from additional technical signals and consider market context before making trading decisions based on the Bullish Engulfing Pattern.
It is crucial to employ proper risk management practices and not rely solely on this pattern for trading decisions. Market conditions can change, and losses are always a possibility. By combining the Bullish Engulfing Pattern with other analysis methods and managing risk effectively, traders can enhance their chances of profitability.
8.2. Is the Bullish Engulfing Candlestick Pattern a double candlestick pattern?
Yes, the bullish engulfing candlestick is a double candlestick pattern since it consists of two candlesticks: a bearish candlestick and one bullish candlestick. The Bullish Engulfing Candlestick is indeed a double candlestick pattern, recognized as a strong indicator in technical analysis for a potential reversal in a downtrend. It consists of a smaller black or red candlestick followed by a larger white or green candlestick that completely engulfs the body of the previous day's candlestick.
8.3. What is the difference between the Bullish Engulfing Candlestick Pattern and the Bearish Engulfing Candlestick Pattern?
The Bullish Engulfing Candlestick Pattern and the Bearish Engulfing Candlestick Pattern are two opposite formations. The Bullish Engulfing Pattern indicates a potential reversal from a downtrend to an uptrend. It consists of a smaller bearish candlestick followed by a larger bullish candlestick that engulfs the body of the first candlestick.
On the other hand, the Bearish Engulfing Candlestick Pattern suggests a shift from an uptrend to a downtrend. It features a larger bearish candlestick that engulfs the smaller preceding bullish candlestick.

Source: Mitrade
Both patterns are significant in technical analysis as they indicate a potential change in market sentiment and trend direction. Traders use these patterns to make informed decisions about market entries and exits.
8.4. What are the typical timeframes for using the Bullish Engulfing Candlestick Pattern?
The Bullish Engulfing Pattern is most commonly observed and considered significant on daily and weekly charts. Higher timeframes tend to provide more reliable signals for this type of analysis. The effectiveness of the pattern can be enhanced when it coincides with other technical indicators or significant support and resistance levels, indicating a higher probability of a market reversal.
While the Bullish Engulfing Pattern can also be observed on lower timeframes, such as hourly or 15-minute charts, traders often give more weight to signals appearing on longer timeframes. It is important to consider the specific market and trading strategy when determining the appropriate timeframe for using the Bullish Engulfing Candlestick Pattern.
Before making any trading decisions, it is important to equip yourself with sufficient fundamental knowledge, have a comprehensive understanding of market trends, be aware of risks and hidden costs, carefully consider investment targets, level of experience, risk appetite, and seek professional advice if necessary.
Furthermore, the content of this article is solely the author's personal opinion and does not necessarily constitute investment advice. The content of this article is for reference purposes only, and readers should not use this article as a basis for any investment decisions.
Investors should not rely on this information as a substitute for independent judgment or make decisions solely based on this information. It does not constitute any trading activity and does not guarantee any profits in trading.
If you have any inquiries regarding the data, information, or content related to Mitrade in this article, please contact us via email: insights@mitrade.com. The Mitrade team will carefully review the content to continue improving the quality of the article.


