


Applied Materials vs. Nvidia: Which Tech Stock Is a Better Buy for 2027?
Key Points
Applied Materials provides the foundational machinery and software required to manufacture advanced chips and display screens.
Nvidia dominates the artificial intelligence hardware market with its powerful graphics processors and full-stack computing systems.
Which semiconductor stock deserves a spot in your portfolio?
- Motley Fool Issues Rare "Total Conviction" Buy Alert ›
The global semiconductor industry is undergoing a massive transformation driven by the rapid expansion of artificial intelligence. Choosing between Applied Materials (NASDAQ:AMAT) and Nvidia (NASDAQ:NVDA) requires understanding whether you want to own the tools or the chips.
Applied Materials builds the specialized equipment and software used to manufacture semiconductors, making it a foundational player in the hardware supply chain. Nvidia designs the high-performance graphics processors and systems that power modern data centers. Both companies are central to the future of technology, but they offer different risk and reward profiles for investors.
The case for Applied Materials
Applied Materials provides materials engineering solutions and specialized equipment used to manufacture semiconductors and display screens. It serves a global customer base primarily among semiconductor stocks, including manufacturers of advanced logic and memory chips. In its latest annual report, the company noted that two major customers accounted for nearly 19% and 15% of net revenue, and such customer concentration adds a layer of risk to the business.
In the 12 months ended Oct. 25, 2026, revenue reached approximately $34.4 billion, an increase of nearly 21.4% over the prior 12-month period. Net income for this time frame was roughly $10.1 billion, resulting in a healthy net margin of close to 29.3%. This expansion followed a period of steady demand for manufacturing equipment as chipmakers expanded their global production capacity.
As of its October 2026 balance sheet, the debt-to-equity ratio was nearly 0.3. This metric measures total debt relative to shareholder equity to show how much a company relies on borrowed funds to finance its operations. The current ratio, which compares short-term assets to liabilities, was approximately 2.3. In the fiscal year ended Oct. 25, 2026, free cash flow reached nearly $6.2 billion.
The case for Nvidia
Nvidia designs the high-performance graphics processors, systems, and software that define the modern artificial intelligence landscape. The company describes itself as a full-stack infrastructure provider, serving clients across data centers, gaming, and professional visualization. In its latest annual report, Nvidia disclosed that sales to one direct customer accounted for approximately 22% of revenue, while another accounted for nearly 14%, creating significant concentration risk.
In the 12 months ended Oct. 25, 2026, revenue reached nearly $361.8 billion, representing a massive 93.3% increase over the previous 12 months. Net income climbed to approximately $226.3 billion, producing a robust net margin of roughly 62.5% for the period. This exponential growth reflects the intense and sustained global demand for high-end computing hardware used in training complex AI models.
As of its January 2026 balance sheet, the debt-to-equity ratio was roughly 0.1. The current ratio was approximately 3.9. In the fiscal year ended Jan. 25, 2026, free cash flow was approximately $96.7 billion.
Risk profile comparison
Applied Materials faces significant exposure to the highly cyclical and volatile semiconductor industry. The company maintains a heavy concentration of operations in China, Taiwan, and Korea, which creates risks from changing trade policies. Furthermore, a recent $252 million settlement regarding shipments to a restricted entity highlights the ongoing risk of export control compliance.
Nvidia relies heavily on third-party foundries like Taiwan Semiconductor Manufacturing Company (NYSE:TSM) for production, which reduces its control over manufacturing yields. The company faces potential volatility from ongoing securities class action lawsuits and the challenges of managing transitions to new product architectures. Finally, Nvidia is in the midst of an unexpected leadership transition, which introduces its own uncertainties.
Valuation comparison
Nvidia appears cheaper based on forward P/E estimates of future profits, while Applied Materials carries a lower P/S ratio relative to sales over the past 12 months.
| Metric | Applied Materials | NVIDIA |
|---|---|---|
| Forward P/E | 17.6 | 15.1 |
| P/S ratio | 7.8 | 9.7 |
Valuation metrics include sourcing from Financial Modeling Prep (FMP) and may differ from other data providers.
Which stock would I buy for 2027?
What a time to be picking stocks, am I right? The market's having a minor meltdown, but tech names in particular are taking it on the chin. Nvidia is also dealing with the sudden departure of co-founder and CEO Jensen Huang following the revelation of multiple extramarital affairs. The year-to-date chart looks grim:
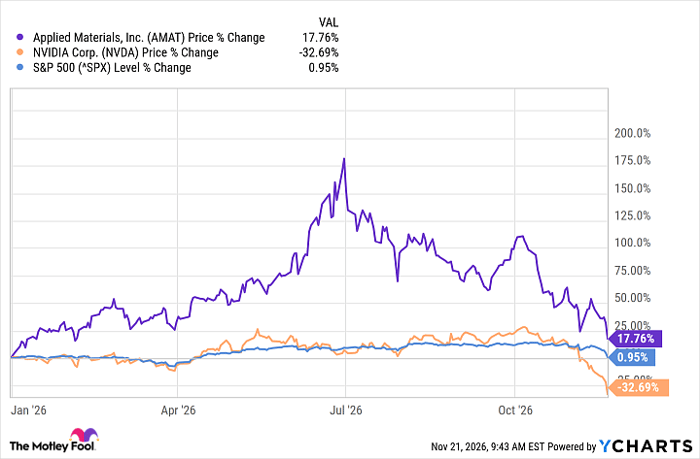
AMAT data by YCharts
That said, widening our perspective out to the past 10 years, both stocks have put in strong performances, handily outpacing the S&P 500's (SNPINDEX:^GSPC) return:
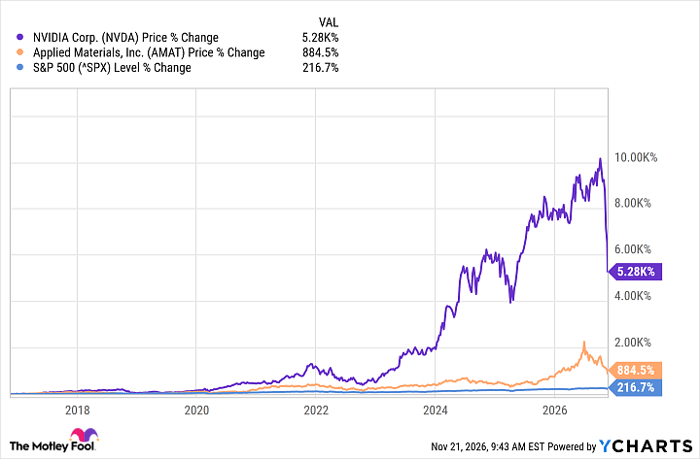
NVDA data by YCharts
I have in the past expressed my general doubts regarding Nvidia because its growth is largely tied to the AI boom. "A boom doesn't look very different from a bubble," I wrote. I don't feel differently now. Sure, Anthropic (NASDAQ:ANT) had a record public debut just days ago, but it gave up a lot of its first-day gains.
Applied Materials' growth and profitability can't hold a candle to Nvidia's, but I think investing in Nvidia right now may be like trying to catch a falling knife. I'd sit this one out.
Should you buy stock in Applied Materials right now?
Before you buy stock in Applied Materials, consider this:
The Motley Fool Stock Advisor analyst team just identified what they believe are the 10 best stocks for investors to buy now… and Applied Materials wasn’t one of them. The 10 stocks that made the cut could produce monster returns in the coming years.
Consider when Netflix made this list on December 17, 2004... if you invested $1,000 at the time of our recommendation, you’d have $305,941!* Or when Nvidia made this list on April 15, 2005... if you invested $1,000 at the time of our recommendation, you’d have $771,325!*
Now, it’s worth noting Stock Advisor’s total average return is 719% — a market-crushing outperformance compared to 192% for the S&P 500. Don't miss the latest top 10 list, available with Stock Advisor, and join an investing community built by individual investors for individual investors.
See the 10 stocks »
*Stock Advisor returns as of November 21, 2026.
Erin Kennedy has positions in Taiwan Semiconductor Manufacturing. The Motley Fool has positions in and recommends Applied Materials, Nvidia, and Taiwan Semiconductor Manufacturing. The Motley Fool recommends Anthropic. The Motley Fool has a disclosure policy.
Recommended Articles


