


Good News: "Trumpflation" Might Go Away Soon. Here's What This Means for Stocks.
Key Points
63% of midterm election voters blamed President Trump’s policies for higher inflation.
Inflation spiked following the start of the Iran war in February 2026.
Vanguard research suggests that inflation effects of tariffs and Iran war-related energy price spikes could go away in 2027.
- Motley Fool Issues Rare "Total Conviction" Buy Alert ›
A big reason why Donald Trump was reelected as U.S. president in 2024 is that voters wanted him to fix inflation. High costs of living have dogged the U.S. economy since the pandemic, with the inflation rate reaching highs over 9% in 2022.
The Fed has set 2% inflation as its official target. But for the past several years, inflation has been higher than that. The Fed's preferred metric for inflation, the Personal Consumption Expenditures (PCE) price index, has been above target since February 2021 -- almost six years.
Missed Nvidia in 2009? This Rare Signal Is Flashing Again. In 2009, a "Double Down" signal flashed for a little-known chipmaker called Nvidia. For the first time in years, that same "Total Conviction" signal is flashing for a company 1/100th the size of Nvidia. Continue »
Inflation has been a challenge to countries around the world and to U.S. presidents of both parties ever since 2020. The pandemic caused global supply chain disruptions and massive amounts of government borrowing to get through the crisis.
Unfortunately, it seems that Trump's policies in his second term as president have largely made inflation worse. In the recent November midterm election, exit polls indicated that a majority of voters blamed Trump policies for higher prices.
Let's look at why "Trumpflation" might be a big culprit in American consumers' current dissatisfaction about the economy -- and why new Vanguard research shows signs of hope for lower inflation and strong economic growth in 2027.

Image source: Getty Images.
Trumpflation: Higher prices fueled by tariffs and war
Trump imposed sweeping new tariffs in 2025 that effectively act as a tax on imports, driving up costs for businesses and consumers. Trump started a war with Iran in February 2026, which has caused global disruptions to the oil market, raising oil prices and driving up costs for household energy bills, gasoline, and diesel fuel. Higher energy costs spill over into the entire economy, driving up prices for airfare, farm fertilizer, food on grocery store shelves, and any consumer goods shipped by truck.
Although these Trump policies have not been severe enough to cause a recession, they have caused a noticeable uptick in inflation. This chart shows what has happened to inflation since Donald Trump took office in January 2025. Look at that big spike after February 2026, when the Iran war started.
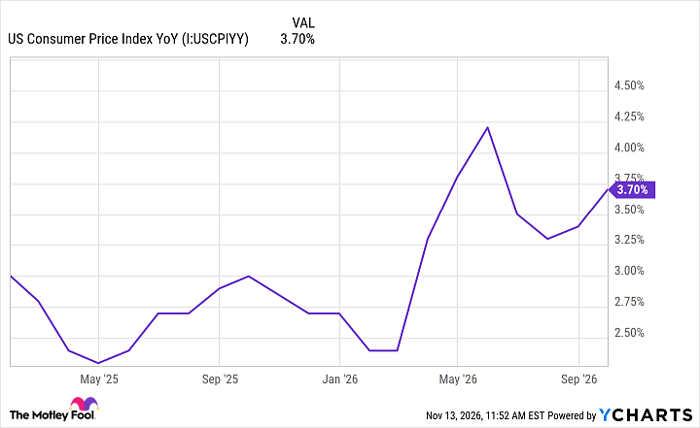
US Consumer Price Index YoY data by YCharts
It's possible that inflation might have already "gotten better" -- that America would already have lower inflation in line with the Fed's 2% target -- if not for Donald Trump. According to Motley Fool research, higher energy costs are the biggest factor behind why overall inflation remains so high. Energy inflation was nearly 10 times higher than overall inflation as of September.
But if you want lower inflation, the future is looking more hopeful.
Vanguard: Tariff and energy price shocks might get better soon
Recent Vanguard research found that inflation is being driven by three major price shocks: tariffs, energy prices, and artificial intelligence (AI) industry demand. Two of those driving forces were caused by Trump's own decisions -- "Trumpflation."
However, Vanguard's analysis has a hopeful message. Tariff effects on inflation are likely to fade soon, as the one-time increase in tariff costs gets “rolled off” from the official year-over-year inflation data. (This doesn't mean the tariffs go away, but the way they are measured will change; the tariff effect on inflation is already built into the economy and will not drive inflation higher.) By April 2027, just from this tariff "roll-off" effect, Vanguard forecasts that core inflation could drop to 2.5%. As of September 2026, the Fed's core inflation rate (PCE price index excluding food and energy) was 3.1%.
What about energy prices? Vanguard's analysis suggests that high energy prices might not subside as quickly, but unless they rise again, their contribution to inflation could be more limited in 2027. Vanguard forecasts a core inflation rate of 2.5% by the end of 2027, with 3% gross domestic product (GDP) growth and only 4.4% unemployment.
How to invest for lower inflation in 2027
There's no guarantee that Vanguard's analysis is correct. However, if you agree that the biggest inflation effects of Trump's tariffs are already "baked in," and that the energy price surge from the Iran war might slowly go away over the next few months to a year, it's reasonable to think that inflation could go lower in 2027.
If both "Trumpflation" policy shocks of tariffs and energy costs go away soon (and Vanguard believes they will), that means inflation might already be closer to the Fed's 2% target. That means fewer Fed rate hikes, lower interest rates, and possibly higher stock prices. The economy could keep growing strong into 2027 and beyond, without getting stuck in "stagflation."
If you're bullish on a future of lower inflation, buying an S&P 500 exchange-traded fund (ETF) is usually a good choice. The Vanguard S&P 500 ETF (NYSEMKT:VOO) holds the 500 largest publicly traded stocks in America. The Vanguard S&P 500 ETF has delivered annualized returns of about 12% in the past five years.
If America can get to the other side of the recent spikes in inflation and keep the economy growing strong, this S&P 500 ETF is likely to benefit from that future growth.
Should you buy stock in Vanguard S&P 500 ETF right now?
Before you buy stock in Vanguard S&P 500 ETF, consider this:
The Motley Fool Stock Advisor analyst team just identified what they believe are the 10 best stocks for investors to buy now… and Vanguard S&P 500 ETF wasn’t one of them. The 10 stocks that made the cut could produce monster returns in the coming years.
Consider when Netflix made this list on December 17, 2004... if you invested $1,000 at the time of our recommendation, you’d have $327,620!* Or when Nvidia made this list on April 15, 2005... if you invested $1,000 at the time of our recommendation, you’d have $959,410!*
Now, it’s worth noting Stock Advisor’s total average return is 802% — a market-crushing outperformance compared to 205% for the S&P 500. Don't miss the latest top 10 list, available with Stock Advisor, and join an investing community built by individual investors for individual investors.
See the 10 stocks »
*Stock Advisor returns as of November 17, 2026.
Ben Gran has no position in any of the stocks mentioned. The Motley Fool has positions in and recommends Vanguard S&P 500 ETF. The Motley Fool has a disclosure policy.
Recommended Articles


