

Tesla-SpaceX Merger Expectations Heat Up as Stock Nears $400 in 5-Day Rally, Poised to Gain Over 20% More

Source Tradingkey

TradingKey - On November 12, Eastern Time, Tesla (TSLA) shares extended their recent rally, rising 1.69% to close at $397.45 after hitting an intraday high of $401.22 on trading volume of about 29.15 million shares. This marked a fifth consecutive trading day of gains, bringing TSLA's cumulative rebound over the past five sessions to approximately 15.6%.

Markets have recently renewed their focus on a potential merger between Tesla and SpaceX (SPCX). According to Bloomberg, the two companies are advancing merger talks that could be announced as early as December, though a delay to early 2027 is also possible. Currently, boards and advisors on both sides are still discussing transaction terms and the post-merger governance structure. Musk previously stated that merging the two companies is "a good idea" and confirmed that both sides have established committees of independent directors to evaluate the transaction. Following the news, Tesla shares gained as much as about 1.9% intraday, indicating that merger expectations provided some support for near-term market sentiment.

In terms of potential impact, a merger could integrate Tesla's electric vehicle, Robotaxi, and Optimus robotics businesses with SpaceX's Starlink, AI computing power, aerospace, and Terafab chip initiatives under a single capital platform. This would help reduce duplicative investments and strengthen synergies across AI, robotics, and computing infrastructure. However, exchange ratios and valuation plans have not yet been announced, and whether the transaction is accretive to existing Tesla shareholders will depend on final pricing. In addition, SpaceX holds U.S. defense contracts, while Tesla is highly reliant on its manufacturing and sales ecosystem in China; therefore, the transaction could face U.S. national security scrutiny and bilateral regulatory reviews.
tsla-5375cc26a89a44598c9c2f5596391ff3

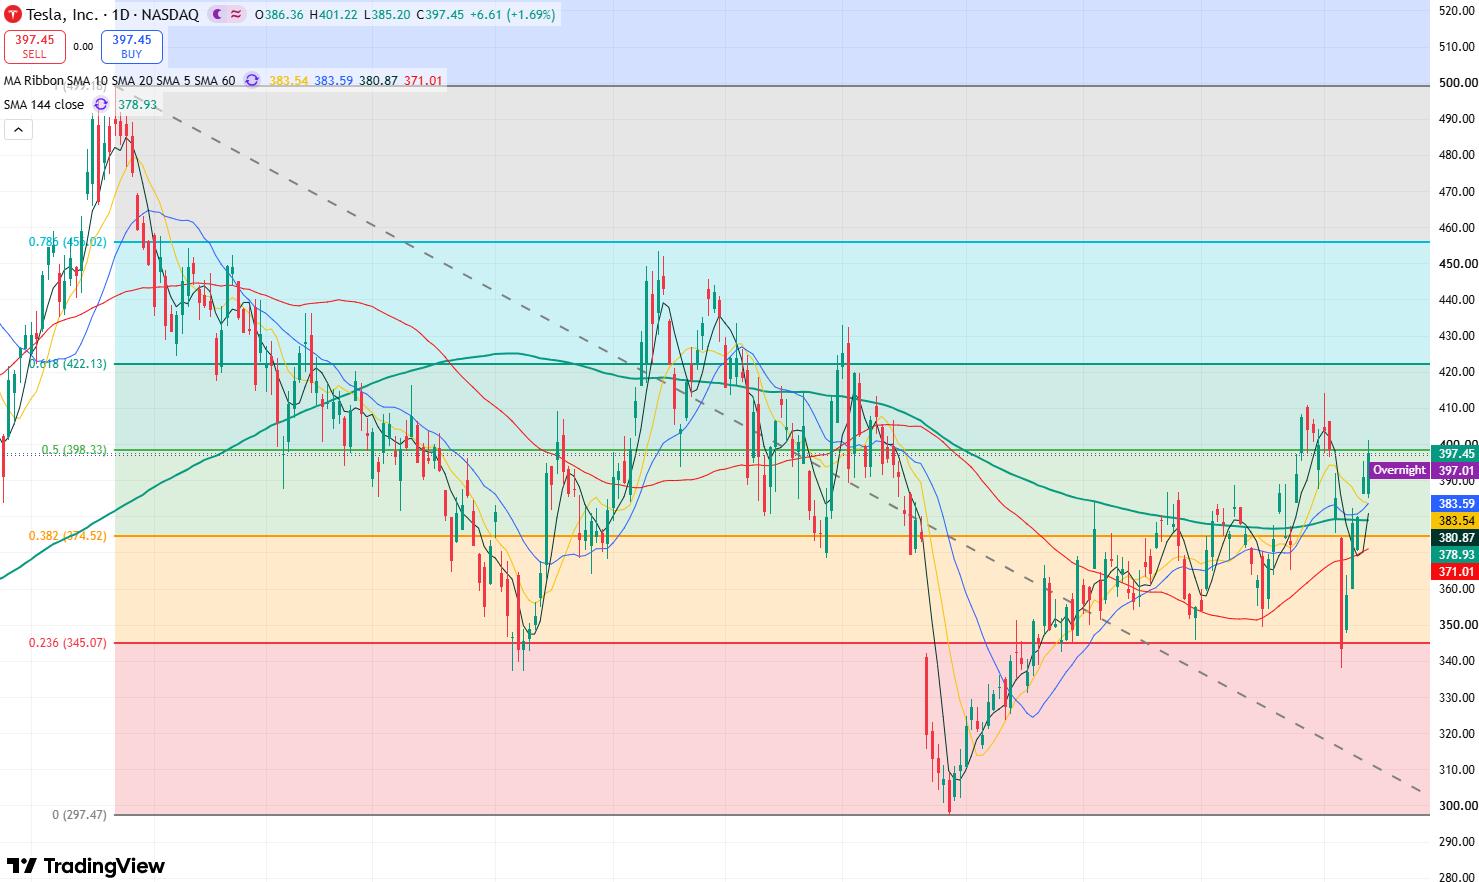
Tesla daily stock price chart, Source: TradingView

Looking at Tesla's daily stock chart, after previously forming an interim low near $300, the stock has staged a continuous rebound. Although it recently pulled back sharply from above $410 to around $340, it subsequently rebounded for five consecutive trading sessions to reclaim the $400 level, indicating a significant improvement in the short-term price structure.

Meanwhile, the stock has moved back above key moving averages, including the 5-day, 10-day, 20-day, 60-day, and 144-day lines, indicating that the short-term weak technical structure caused by the prior sharp decline has been noticeably repaired.

From the perspective of the Fibonacci retracement structure, the most critical level currently is $400, corresponding to the 0.5 retracement level of the prior $297.47–$499 rally. The latest closing price of $397.45 sits just below this level, making $398–$400 the core battleground for bulls and bears in the near term.

If the stock can decisively hold above $400, the initial upside focus will be on the recent high zone of $410–$414, followed by $422.13, which corresponds to the 0.618 Fibonacci level. A breakout above $422 would open up upside toward $450, representing more than 20% upside potential from the current price.

On the downside, initial support should be watched in the $385–$380 range, which sits near the strong confluence of multiple moving averages. If the stock falls below $380, it could test the $370–$375 range to the downside.

Disclaimer: For information purposes only. Past performance is not indicative of future results.
placeholder
China's factories are pricing in 5.7%. Its shoppers are pricing in 0.7%.China's October PPI rose 5.7% year on year, the fastest since June 2022, while CPI slowed to 0.7% and core CPI to 0.8%. Input prices rose faster than factory-gate prices, squeezing mid-stream margins by roughly five percentage points. The Hang Seng fell 0.13% on a day the S&P 500 rose 2.35%, the only major market to sit out the risk-on session.
Author  Irene Q.
Nov 10, Tue
China's October PPI rose 5.7% year on year, the fastest since June 2022, while CPI slowed to 0.7% and core CPI to 0.8%. Input prices rose faster than factory-gate prices, squeezing mid-stream margins by roughly five percentage points. The Hang Seng fell 0.13% on a day the S&P 500 rose 2.35%, the only major market to sit out the risk-on session.
placeholder
Gold Price Analysis Today | Forex Gold Analysis | XAU/USD Analysis - November 11, 2026Get the latest gold price analysis, forex gold insights, and XAU/USD analysis for November 11, 2026. Read on for the details.
Author  Mitrade
Nov 11, Wed
Get the latest gold price analysis, forex gold insights, and XAU/USD analysis for November 11, 2026. Read on for the details.
placeholder
Bitcoin lost its 200-day average — but the exit started three sessions before the CPIBitcoin fell 2.5% to about $73,400 on 11 November, an 11-week low, breaking its 200-day moving average near $73,100. The 24-hour liquidation tally reached $632 to $705 million, roughly 82% of it longs. But spot ETF outflows began three sessions earlier and USDT's market cap has shrunk $6.6 billion in 60 days — the leveraged length left before the inflation print did. A double top at 81,890 and 81,080 leaves a measured target of 69,366.
Author  Suzie
Nov 11, Wed
Bitcoin fell 2.5% to about $73,400 on 11 November, an 11-week low, breaking its 200-day moving average near $73,100. The 24-hour liquidation tally reached $632 to $705 million, roughly 82% of it longs. But spot ETF outflows began three sessions earlier and USDT's market cap has shrunk $6.6 billion in 60 days — the leveraged length left before the inflation print did. A double top at 81,890 and 81,080 leaves a measured target of 69,366.
placeholder
Gold Extends Slide Below $4,000 as Rising US Inflation, Fed December Hike Bets Pressure Prices On November 12, gold prices (XAUUSD) extended their recent losses, falling further below $4,000 in early Asian trading to hit an intraday low near $3,968, marking a third consecutive day
Author  TradingKey
Yesterday 02: 00
On November 12, gold prices (XAUUSD) extended their recent losses, falling further below $4,000 in early Asian trading to hit an intraday low near $3,968, marking a third consecutive day
placeholder
Gold closed below $4,000 again — the ETF crowd and central banks stayed, the momentum money leftSpot gold is trading near $3,999, its third consecutive lower daily low, after a 5.00% 10-year yield and a 102.85 dollar index raised the odds of a December hike to 87%. But the selling is not coming from the strategic holders: managed-money net longs fell to 324 tonnes, a 21-week low, and Goldman Sachs attributes roughly 95% of five weeks of selling to non-reportable positions. ETFs still hold a record 4,256 tonnes and central banks bought 321 tonnes in Q3. The table below sets the triggers, directions and levels.
Author  Irene Q.
Yesterday 03: 20
Spot gold is trading near $3,999, its third consecutive lower daily low, after a 5.00% 10-year yield and a 102.85 dollar index raised the odds of a December hike to 87%. But the selling is not coming from the strategic holders: managed-money net longs fell to 324 tonnes, a 21-week low, and Goldman Sachs attributes roughly 95% of five weeks of selling to non-reportable positions. ETFs still hold a record 4,256 tonnes and central banks bought 321 tonnes in Q3. The table below sets the triggers, directions and levels.
goTop
quote