


Bitcoin just posted five straight losing weeks, and the storm may not be over yet
Bitcoin (BTC) is struggling to find support, slipping below $70,000 as multiple headwinds threaten to push the Crypto King lower. The much-anticipated “Uptober” rally failed to materialize, with persistent selling pressure and widespread liquidations instead reinforcing the “Rektober” narrative, a term describing an October marked by sharp losses rather than the gains traditionally associated with the month.
The weakness has extended into November, with subdued institutional demand, cautious derivatives positioning and deteriorating on-chain metrics all suggesting fading market confidence.
Adding to this bearish thesis, persistent inflation concerns, a stronger US Dollar (USD), the Binance hack, and MSCI’s decision to remove major Bitcoin treasury holding companies from its global indexes are pressuring risk-sensitive assets, increasing the chance that a big storm is heading to the Crypto King.
Sticky inflation revives rate-hike fears
The largest cryptocurrency by market capitalization is highly sensitive to liquidity conditions, making it vulnerable to tighter monetary policy. Higher interest rates and reduced liquidity tend to weigh on non-yielding assets such as BTC by increasing the opportunity cost of holding them, and investors prefer safe-haven assets such as the Greenback and US Treasury bonds.
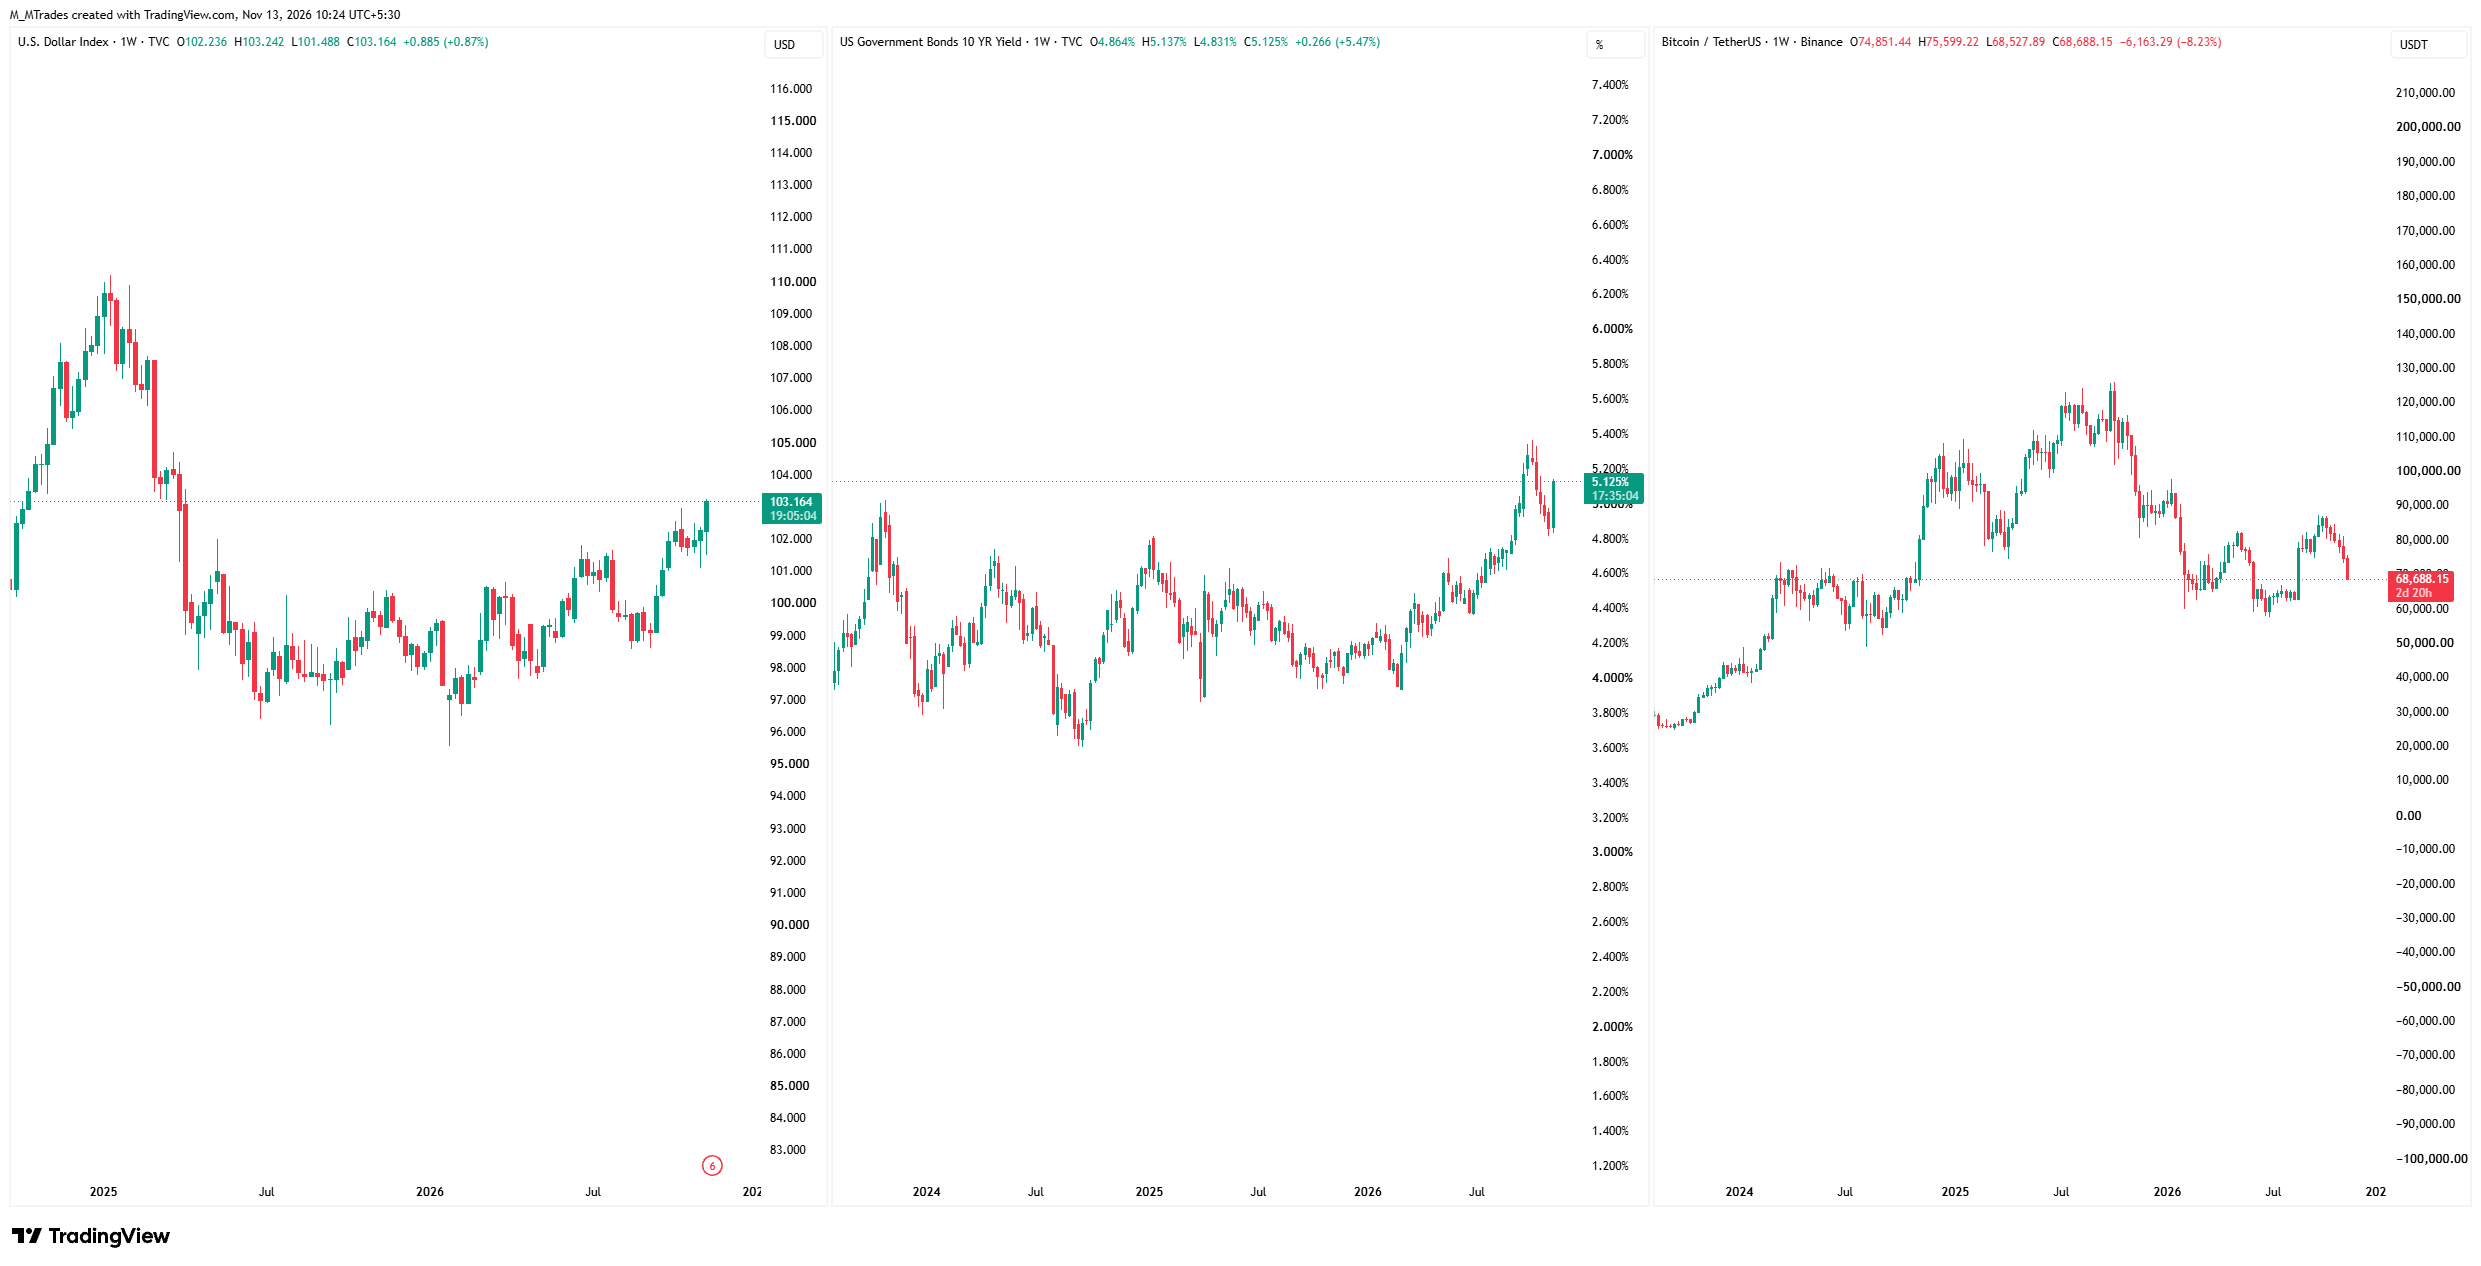
The macroeconomic backdrop through November has largely favored the Federal Reserve (Fed) to maintain a relatively restrictive monetary stance, which added support to USD but pressured risky assets.
Stronger-than-expected US employment data for October, released in the first week of November, highlighted that the US labor market remains resilient, giving the central bank less reason to ease monetary policy. This was followed by hotter-than-expected US October Consumer Price Index (CPI) data, which further strengthened expectations of tighter monetary conditions.
The CPI report specifically raised the odds that the Fed will hike interest rates in December. Fed Governor Christopher Waller warned that a stronger-than-expected core CPI could prompt him to consider a larger 50-basis-point (bps) rate hike at the December 8–9 policy meeting. He added that limiting the increase to 25 bps could put the Fed’s credibility at risk.
This hawkish stance amid rising inflation concerns has pushed 10-year US Treasury yields and the DXY Index higher and is weighing on Crypto King’s prices.
Weaker demand from institution
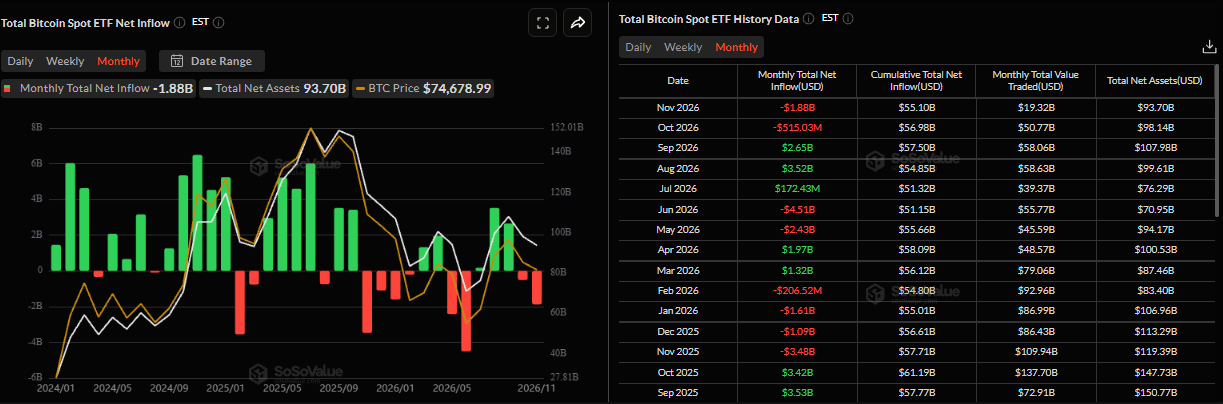
On the institutional front, spot demand is also weakening. US-listed spot Bitcoin Exchange Traded Funds (ETFs) recorded over $500 million in net outflows in October, with withdrawals accelerating to $1.88 billion so far in November, the highest monthly outflow since June.
The shift in investors’ sentiment and fading demand, contrasting with the strong inflows recorded in August and September, has removed a key source of consistent buying that previously cushioned and absorbed selling pressure.
MSCI’s index exclusion puts major corporate BTC holders under pressure
Corporate demand, which has historically helped cushion Bitcoin during sharp corrections, faces another setback this week. On Wednesday, global index provider MSCI confirmed it would remove Strategy from its global indexes, the MSCI USA Index and the MSCI World Index. Strategy, the largest corporate holder of Bitcoin, currently holds 850,364 BTC.
The decision means that index funds tracking the affected benchmarks may need to sell their Strategy shares by November 30 to reflect the changes in their portfolios. Although MSCI’s decision directly affects Strategy’s stock rather than its Bitcoin holdings, the consequences could extend to the cryptocurrency given the company’s position as the largest Bitcoin treasury.
In addition, Tokyo-listed Metaplanet, which also accumulates and holds BTC, was included in the exclusion list. The company will be removed from the MSCI Japan Small Cap Index effective December 1.
These potential forced share sales could weigh on these BTC-holding companies’ stock and indirectly affect BTC sentiment. As these companies serve as an institutional gateway to BTC exposure, sustained selling pressure on their shares could undermine investor confidence in corporate Bitcoin treasury strategies and add another headwind to BTC’s recovery.
Elevated leverage raises risks of sharp moves
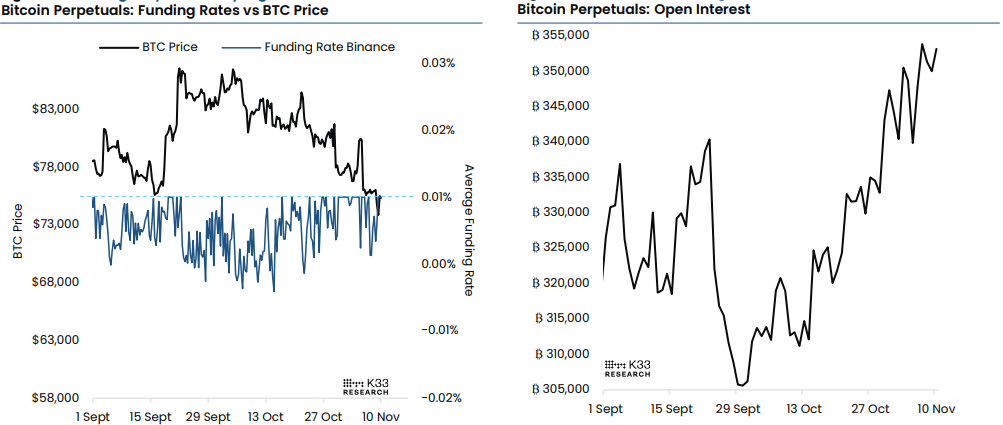
In the derivatives market, the risk of sharp price moves remains elevated for the Crypto King as leverage continues to build.
Open Interest (OI) in BTC perpetual futures stands at 353,000 BTC this week, ranking in the 99th percentile of observations over the past two years. Meanwhile, annualized funding rates have averaged 8.4% over the past week, indicating sustained demand for long exposure as BTC tests key support levels.
Historically, similarly elevated open interest has coincided with price extremes and periods of substantial volatility, often preceding sharp reversals. While elevated leverage fueled upside moves in June and August, current positioning appears less directional, leaving considerable scope for volatility in either direction. A breakdown could trigger substantial long liquidations, while a recovery could fuel short covering, amplifying price moves as leveraged positions unwind.
No-regulation related catalyst to support falling prices
The political shift in the US, with Democrats controlling both the House and Senate, raises fresh concerns for the cryptocurrency industry. The change in congressional control could stall or delay important related legislation such as the CLARITY Act, which aims to establish a clearer regulatory framework for digital assets.
This shift has also added uncertainty as investors assess the potential impact of a Democrat-controlled Congress on crypto and AI regulations when the new Congress convenes on January 3, 2027.
The prospect of delayed regulatory clarity, combined with the absence of an immediate bullish catalyst, continues to weigh on market sentiment.
Stolen BTC and ETH funds pose lingering market risks
The late October hack at Binance, the largest centralized cryptocurrency exchange, continues to weigh on market sentiment. However, the exchange has fully absorbed the financial impact and replenished affected user balances by Thursday using its corporate treasury, Secure Asset Fund for Users (SAFUs) fund and other internal resources.
However, roughly $3 billion in stolen assets reportedly remains under the attackers’ control, mostly in BTC and ETH, which cannot be easily frozen. If these funds start moving again, that could bring fresh FUD (fear, uncertainty, and doubt) back into the market.
On-chain perspective: Contracting dry powder
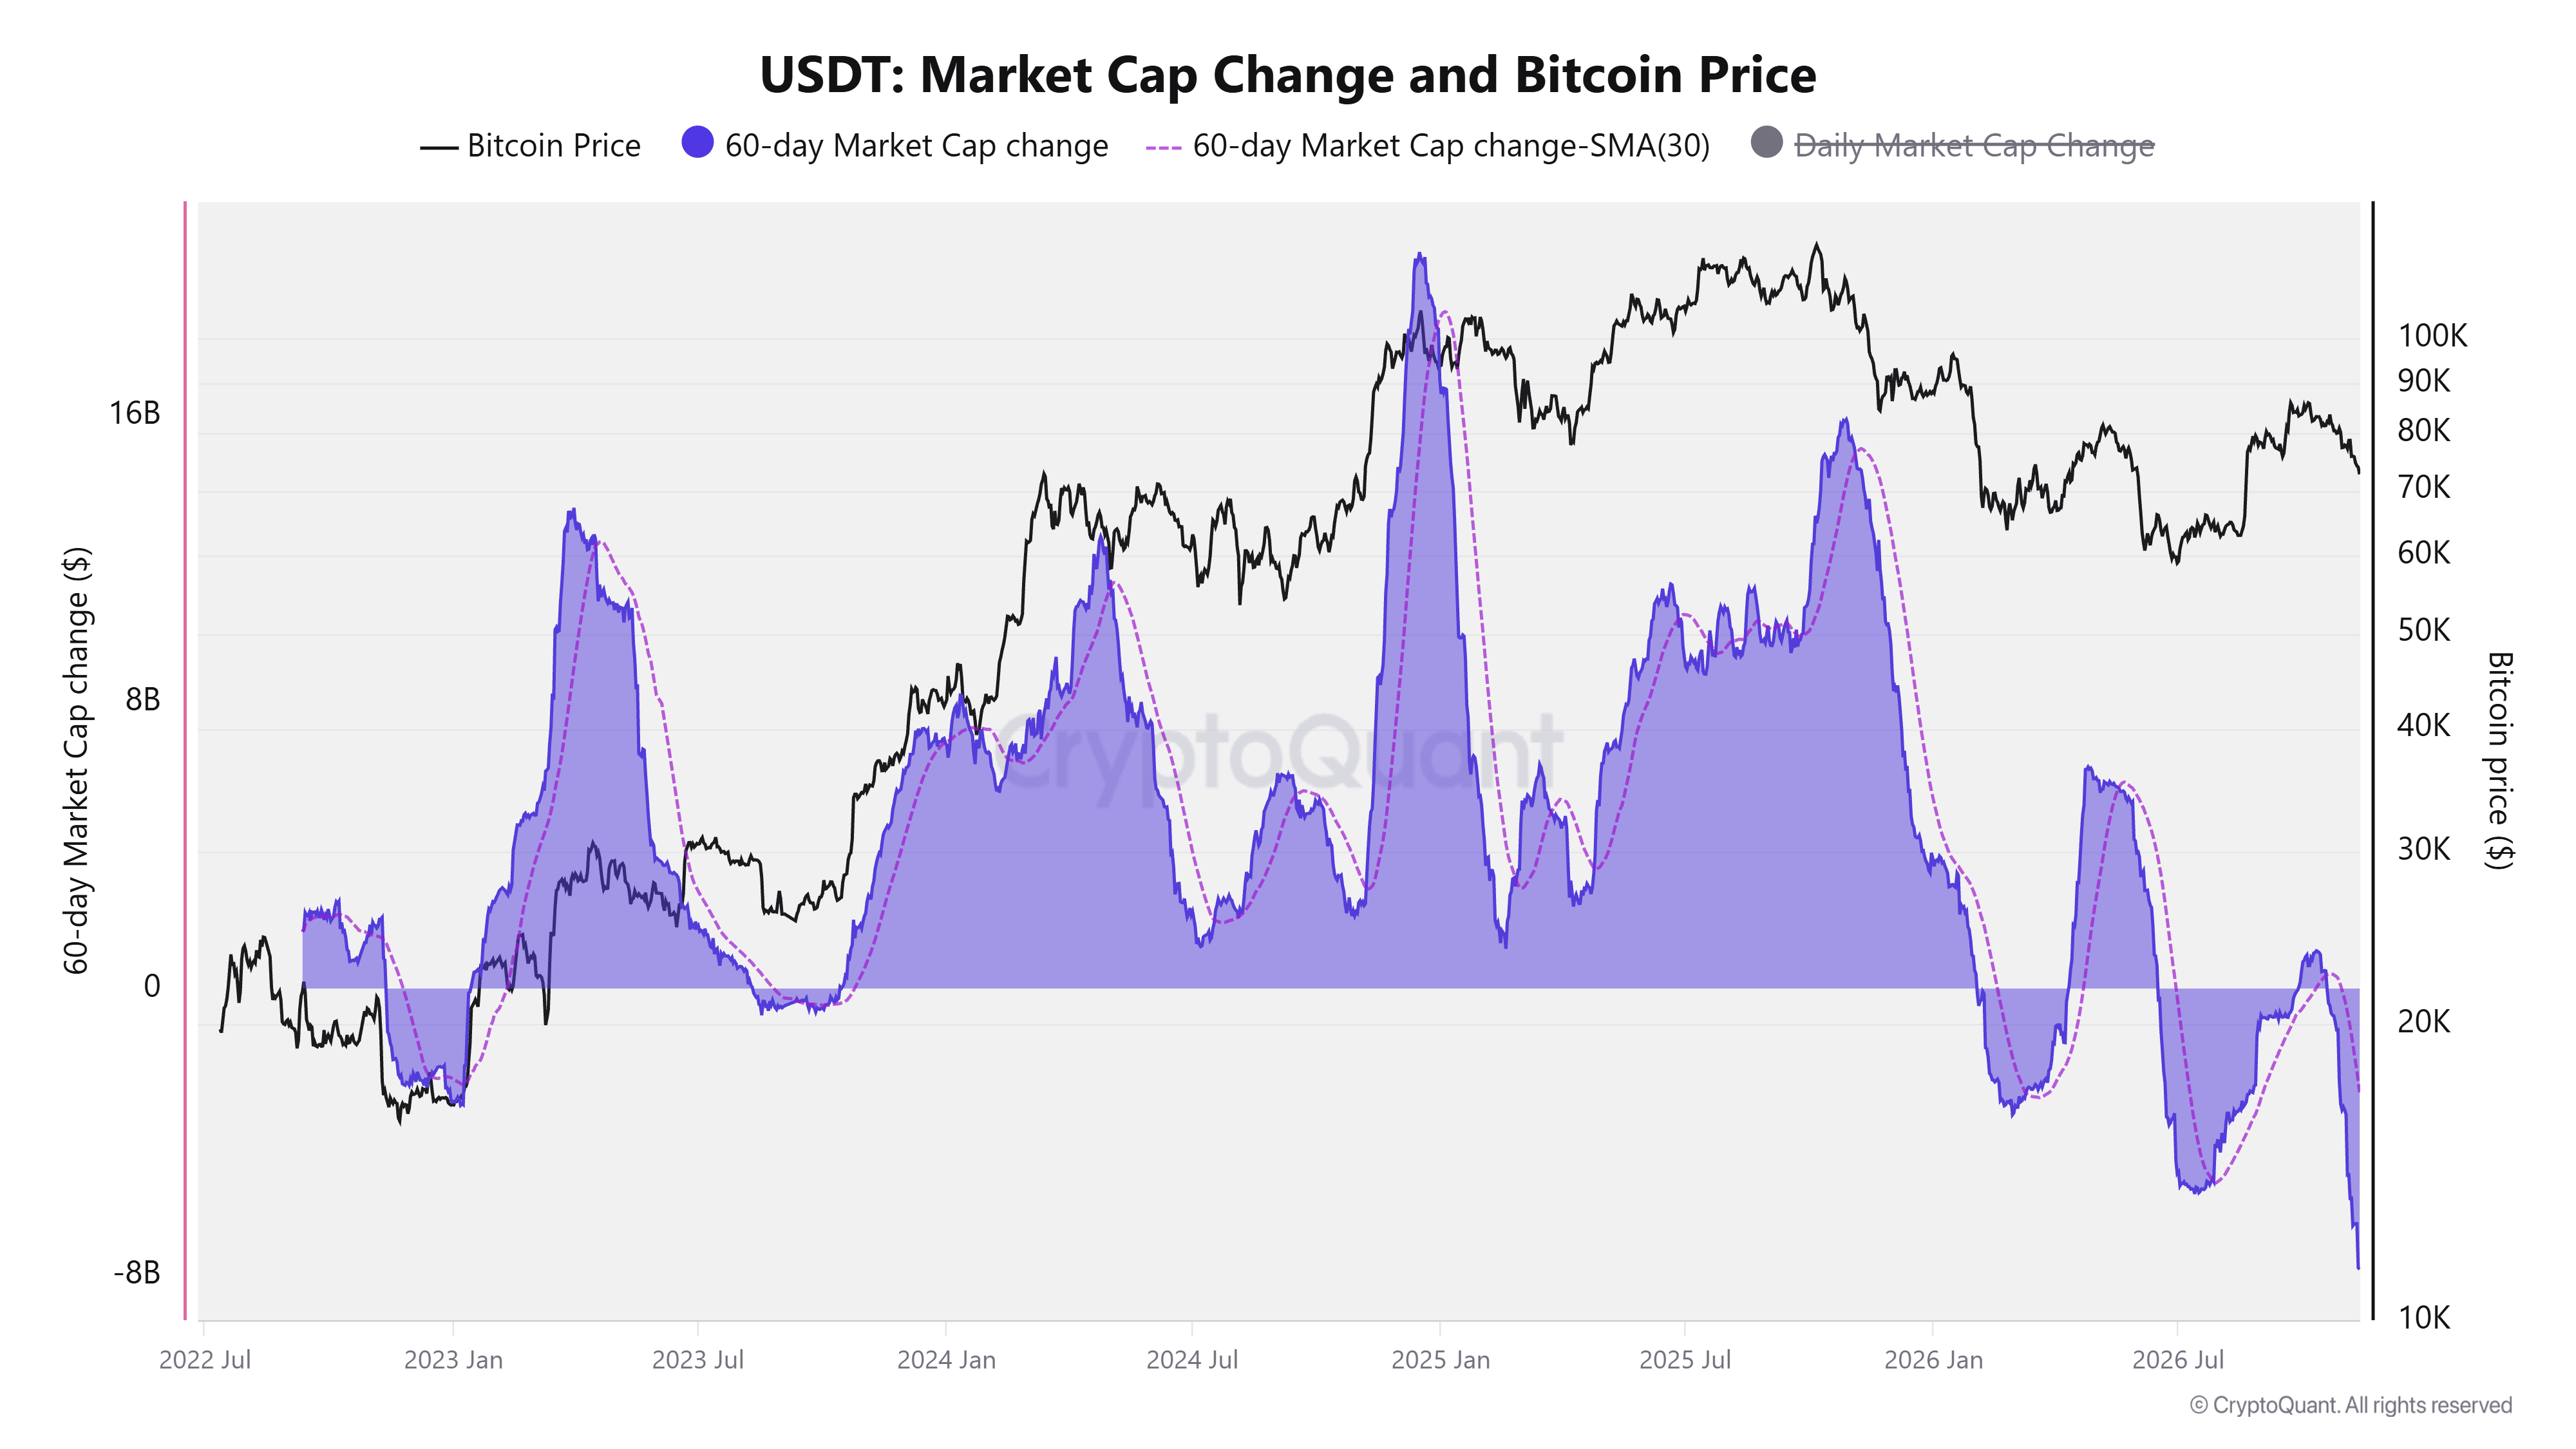
CryptoQuant on-chain data shows that USDT stablecoin liquidity is contracting at its fastest 60-day pace since 2022.
Tether’s market capitalization has declined by $7.81 billion over the past 60 days as of Thursday, as shown in the chart below, marking its largest contraction since mid-2022 and exceeding the post-FTX exchange redemptions level of $3.15 billion back on December 31, 2022.
Stablecoin supply indicates readily available liquidity (dry powder) for the cryptocurrency market. When that supply contracts, less capital is available to flow into BTC, limiting fresh buying demand.
Bitcoin’s rallies during the current market cycle have coincided with stablecoin supply growth, making the recent contraction another headwind for its recovery.
Technical analysis: Slips major support zone
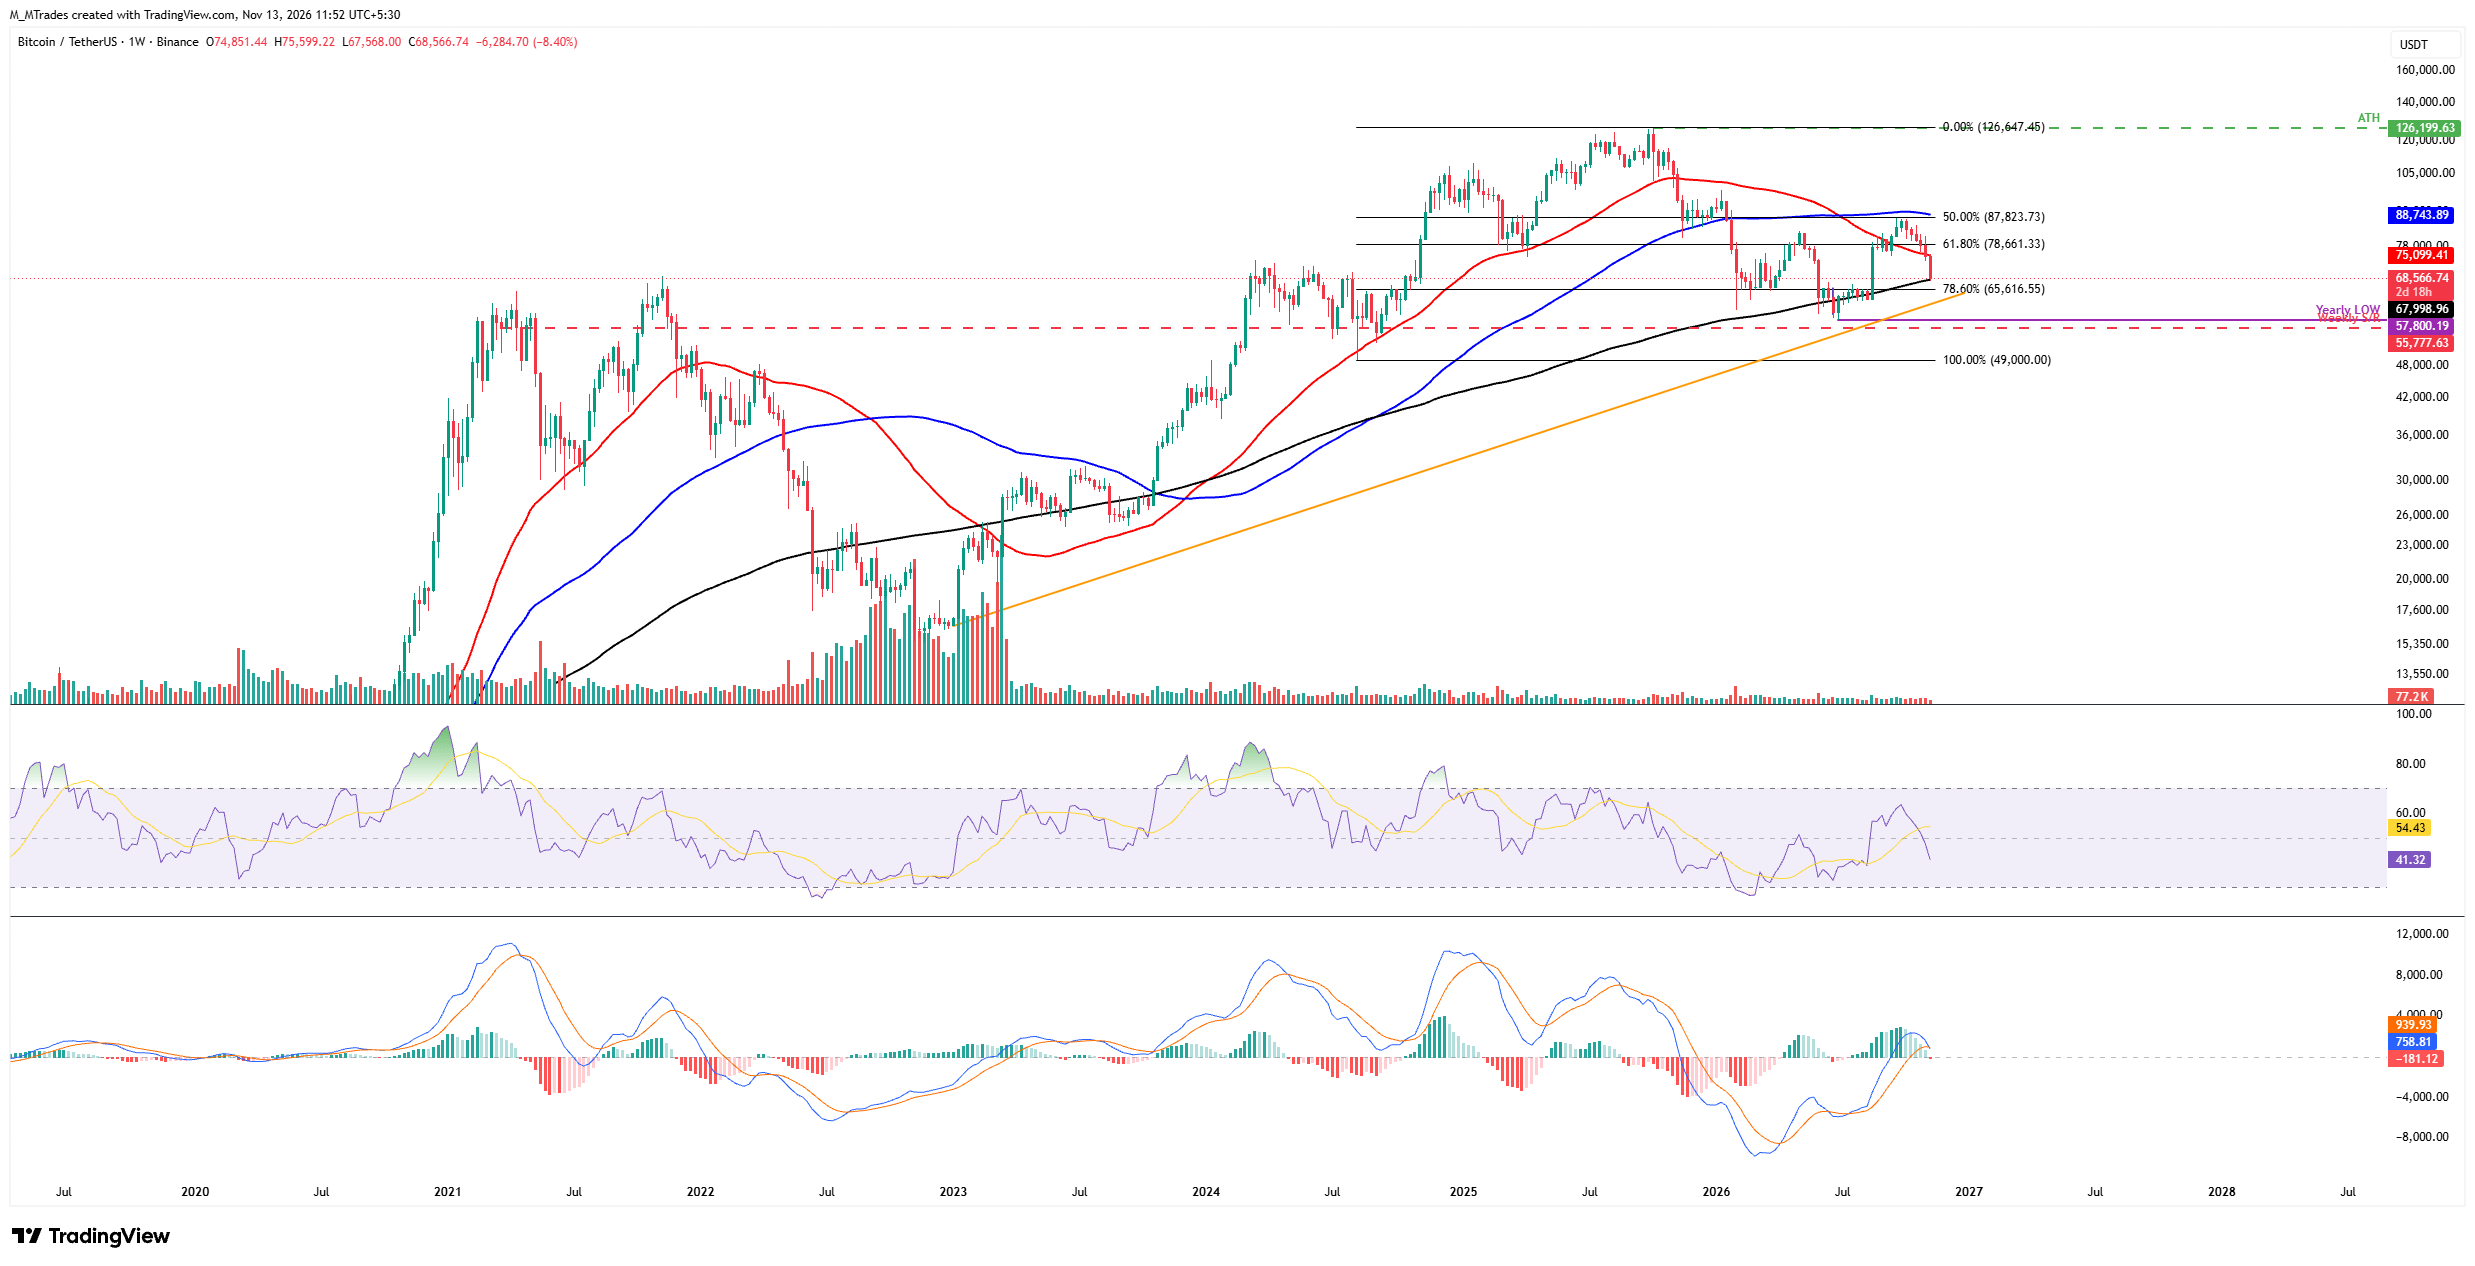
The Crypto King has been correcting since early October, posting five consecutive weeks of losses of more than 13% and closing below the key 50-week Simple Moving Average (SMA) at $75,099 last week. As of this week, BTC extends losses by more than 8.2%, trading below $69,000 on Friday.
If BTC continues its correction, it could fall toward the 200-week SMA at $67,998. A weekly close below this suggests a deeper correction toward the key psychological level at $60,000.
The Relative Strength Index (RSI) on the weekly chart stands at 41, below the neutral 50 level, suggesting fading bullish momentum. Meanwhile, the Moving Average Convergence Divergence (MACD) histogram showed a red bar this week, further supporting the bearish thesis.
On the other hand, if BTC recovers, it could extend the advance toward the 50-week SMA at $75,099. A successful close and hold of this level could extend the recovery toward the 61.8% Fibonacci retracement level of $78,661 (drawn from the August 2024 low of $49,000 to the October 2025 record high of $126,199).
Taken all together, the current market conditions hint at an increasing chance that a big storm is heading to the Crypto King. Until institutional demand stabilizes, liquidity conditions improve, and leveraged positioning resets, Bitcoin’s downside risks are likely to remain elevated, making a sustained recovery difficult and a deeper correction more likely.
Bitcoin, altcoins, stablecoins FAQs
Bitcoin is the largest cryptocurrency by market capitalization, a virtual currency designed to serve as money. This form of payment cannot be controlled by any one person, group, or entity, which eliminates the need for third-party participation during financial transactions.
Altcoins are any cryptocurrency apart from Bitcoin, but some also regard Ethereum as a non-altcoin because it is from these two cryptocurrencies that forking happens. If this is true, then Litecoin is the first altcoin, forked from the Bitcoin protocol and, therefore, an “improved” version of it.
Stablecoins are cryptocurrencies designed to have a stable price, with their value backed by a reserve of the asset it represents. To achieve this, the value of any one stablecoin is pegged to a commodity or financial instrument, such as the US Dollar (USD), with its supply regulated by an algorithm or demand. The main goal of stablecoins is to provide an on/off-ramp for investors willing to trade and invest in cryptocurrencies. Stablecoins also allow investors to store value since cryptocurrencies, in general, are subject to volatility.
Bitcoin dominance is the ratio of Bitcoin's market capitalization to the total market capitalization of all cryptocurrencies combined. It provides a clear picture of Bitcoin’s interest among investors. A high BTC dominance typically happens before and during a bull run, in which investors resort to investing in relatively stable and high market capitalization cryptocurrency like Bitcoin. A drop in BTC dominance usually means that investors are moving their capital and/or profits to altcoins in a quest for higher returns, which usually triggers an explosion of altcoin rallies.
Recommended Articles


