

Nvidia Drops Nearly 10% in Two Days as Jensen Huang Probe Sparks Market Concerns; Stock May Fall Toward $150

Source Tradingkey

TradingKey - On November 10, Eastern Time, Nvidia (NVDA) shares extended their recent decline, falling 5.47% to close at $168.89 after touching an intraday low of $165.89, with trading volume reaching approximately 427 million shares. Previously, on November 9, Nvidia had dropped 4.27%, bringing its two-day cumulative decline to nearly 10%. In the latest overnight trading, the stock rebounded to around $172.90, but the preceding consecutive declines have pushed it significantly below key moving averages, leaving short-term corrective pressure substantial.

Nvidia's recent stock pressure is closely tied to news of an investigation involving CEO Jensen Huang. On November 8, Nvidia's board of directors announced an independent investigation to look into reports that Huang may have been targeted by a foreign intelligence operation, hiring external legal counsel to assist. Media outlets subsequently revealed that Huang had a personal relationship with a woman suspected by U.S. intelligence agencies of having ties to Chinese intelligence, with reports also involving allegations that he may have helped facilitate at least $7.5 billion in Nvidia chip transactions to China. Currently, these allegations remain under investigation and have not been independently verified. Nvidia's board stated there is currently no reason to believe that U.S. national security or company secrets have been compromised, and Huang has pledged to cooperate with the investigation.

The incident's impact on the stock is primarily reflected in corporate governance and management stability. Huang has led Nvidia for more than 30 years and is the central driver of the company's AI chip business and technology strategy, putting his personal reputation and leadership stability in the market spotlight. At the same time, some members of the U.S. Congress have called for further scrutiny of Nvidia's chip exports to China, urging stricter restrictions. If the investigation leads to a further tightening of export policies, Nvidia's future commercial opportunities in the Chinese market could be affected.
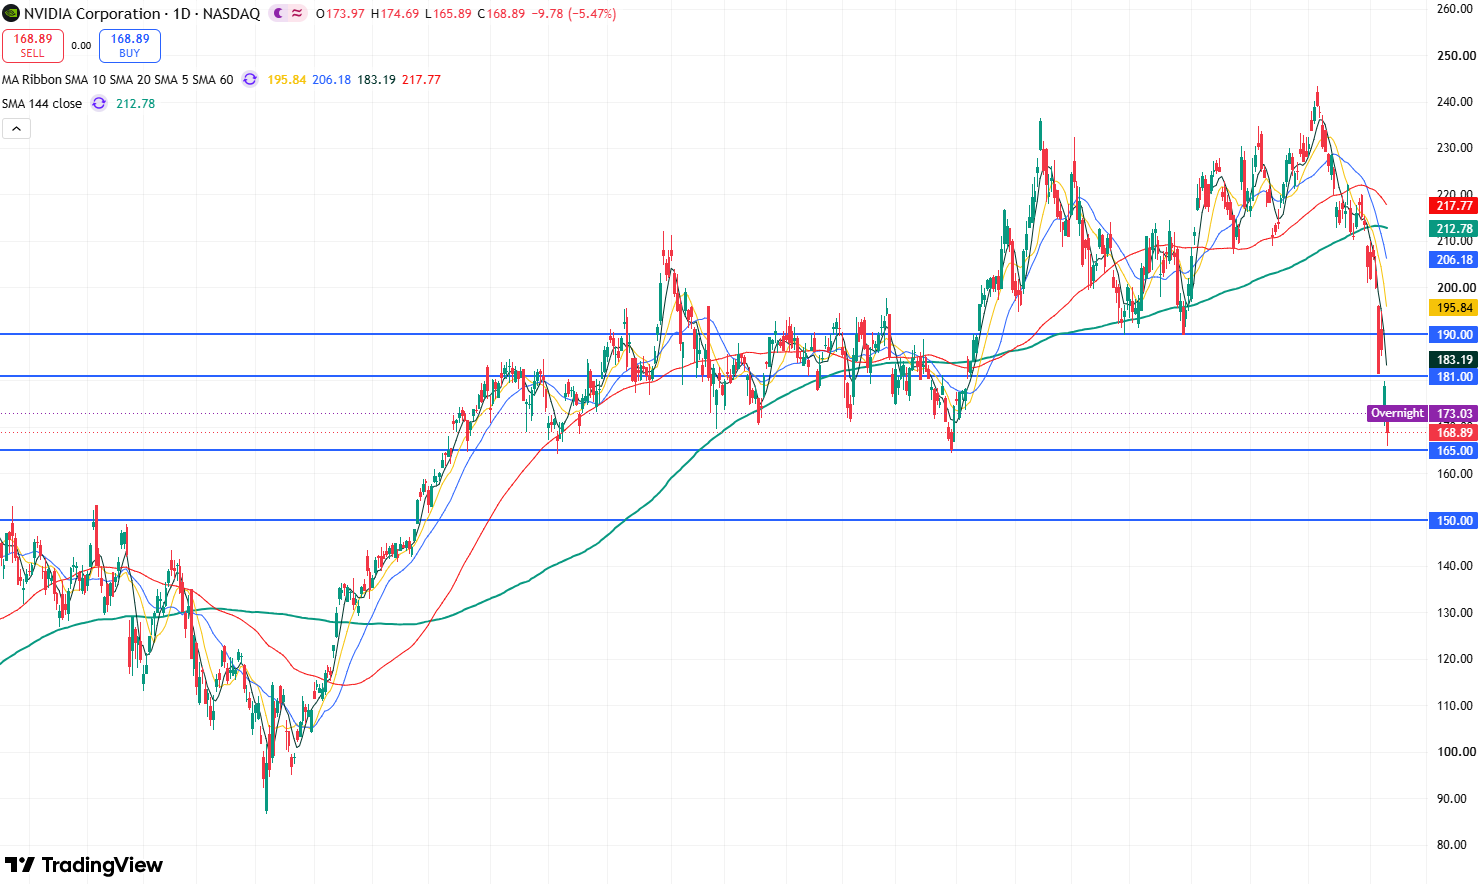
nvda-35d3668719a34715addaaf2f7e7b5ce4

Nvidia Daily Stock Chart, Source: TradingView

Looking at the daily chart of Nvidia's stock price, amid the recent continuous slide, the price action has remained capped by both the 5-day and 10-day short-term moving averages, signaling a visibly weak short-term structure.

In terms of technical indicators, the daily RSI is around 24.3, having entered oversold territory below 30, while the weekly RSI is at about 38.2, also in weak territory. This suggests that the recent pullback has been sharp, though oversold conditions do not mean the stock has confirmed a bottom.

At present, the stock has dropped near the critical support level of $165. If this level fails to hold, further downside potential will open up, potentially sending the stock toward the $150 threshold.

Conversely, if the stock finds support near $165 and stabilizes, it could begin a technical recovery rebound. The primary upside target to watch is the resistance near $170; a breakout above this level would open up upside room toward the $180–$181 resistance zone.

Disclaimer: For information purposes only. Past performance is not indicative of future results.
placeholder
Micron's $4.5 billion Taiwan fab won't make a chip until 2028 — the market sold it as a 2026 problemMicron fell 17.46% to $656.39 after Bloomberg reported construction at its $4.5 billion Taoyuan Fab 11E had all but halted over a labor dispute. The plant was not due online until 2028, so no 2026 output is lost. With FY27 EPS consensus near $160 and 2027 HBM sold out, the selloff is a peak-cycle multiple reset, not a demand collapse — and $650 is the line that separates the two.
Author  Irene Q.
Nov 06, Fri
Micron fell 17.46% to $656.39 after Bloomberg reported construction at its $4.5 billion Taoyuan Fab 11E had all but halted over a labor dispute. The plant was not due online until 2028, so no 2026 output is lost. With FY27 EPS consensus near $160 and 2027 HBM sold out, the selloff is a peak-cycle multiple reset, not a demand collapse — and $650 is the line that separates the two.
placeholder
Weekly Report: Gold up 4.5%, Brent down 16.4% — three commodity regimes just resetGold rose 4.51% to $4,074.90 while Brent fell 16.42% to $98.32 in the same five sessions — two inflation hedges, opposite answers. Around them, the gold-silver ratio sits at 78.7 and copper fell 3.72%. Three regime signals, two of them close to flipping, define what commodity traders must re-price before Tuesday's CPI.
Author  Irene Q.
Nov 09, Mon
Gold rose 4.51% to $4,074.90 while Brent fell 16.42% to $98.32 in the same five sessions — two inflation hedges, opposite answers. Around them, the gold-silver ratio sits at 78.7 and copper fell 3.72%. Three regime signals, two of them close to flipping, define what commodity traders must re-price before Tuesday's CPI.
placeholder
The CPI that has no year-over-year number is the one that decides DecemberOctober CPI lands on Nov 10 at 13:30 GMT, and it will be published without a year-over-year figure: BLS never collected October 2025 prices during the federal shutdown. Consensus is +0.3% headline and +0.2% core month-on-month, against +0.6% and +0.3% in September. With December hike odds at 77%, the month-on-month print is now the whole story, and $4,197–4,202 on gold and 4.86% on the 10-year are the levels that price it.
Author  Irene Q.
Nov 09, Mon
October CPI lands on Nov 10 at 13:30 GMT, and it will be published without a year-over-year figure: BLS never collected October 2025 prices during the federal shutdown. Consensus is +0.3% headline and +0.2% core month-on-month, against +0.6% and +0.3% in September. With December hike odds at 77%, the month-on-month print is now the whole story, and $4,197–4,202 on gold and 4.86% on the 10-year are the levels that price it.
placeholder
Gold Price Analysis Today | Forex Gold Analysis | XAU/USD Analysis - November 10, 2026Get the latest gold price analysis, forex gold insights, and XAU/USD analysis for November 10, 2026. Read on for the details.
Author  Mitrade
Yesterday 01: 38
Get the latest gold price analysis, forex gold insights, and XAU/USD analysis for November 10, 2026. Read on for the details.
placeholder
Nvidia fell 4.3% on a day the Nasdaq rose 2.7% — this is a governance discount, not an AI warningNvidia closed at $178.67 on November 9, down 4.27% with an intraday low of $170.24, while the Nasdaq rose 2.74% and the Philadelphia Semiconductor Index jumped 6.85%. Volume was roughly 2.5 times the prior session. The board opened an independent review after CEO Jensen Huang's public statement about his personal life. With Q3 earnings on November 17, the two levels that matter are $170.24 and $200."
Author  Irene Q.
Yesterday 03: 27
Nvidia closed at $178.67 on November 9, down 4.27% with an intraday low of $170.24, while the Nasdaq rose 2.74% and the Philadelphia Semiconductor Index jumped 6.85%. Volume was roughly 2.5 times the prior session. The board opened an independent review after CEO Jensen Huang's public statement about his personal life. With Q3 earnings on November 17, the two levels that matter are $170.24 and $200."
goTop
quote