


The CPI that has no year-over-year number is the one that decides December


October US CPI prints on Tuesday, Nov 10 at 13:30 GMT — and for the first time in this cycle, the headline year-over-year number will not exist. BLS did not collect October 2025 prices during the federal shutdown, so the bureau will publish month-on-month changes only. The market's whole read on inflation now rests on a single monthly delta: +0.3% headline, +0.2% core, against +0.6% and +0.3% in September.
The number that went missing
| Item | September (actual) | October (consensus) | Range of forecasts |
|---|---|---|---|
| Headline CPI, m/m | +0.6% | +0.3% | +0.19% (Morgan Stanley) ~ +0.3% (ING) |
| Core CPI, m/m | +0.3% | +0.2% | +0.19% ~ +0.3% |
| Headline CPI, y/y | +3.7% | not published | — |
| Core CPI, y/y | +2.6% | not published | — |
| December hike odds | 66% (Oct 30) | 77% | 77% (CME) ~ 81% (LSEG) |
| 10-year Treasury | 4.86% | — | two-month low zone |
The missing year-over-year figure is not a data-quality problem; it is a base-effect problem with a specific cause. Without an October 2025 base, a +0.3% monthly print cannot be turned into an annual rate. That removes the single number most commentary anchors to, and it shifts the entire reaction function onto the monthly detail.
What the month actually says
The consensus is not uniform, and the spread matters more than usual.
Morgan Stanley models +0.19% on both headline and core, citing softer core services — the health-insurance reset, shelter, hotels and airfares normalising — plus weaker used-car prices. Bloomberg Economics sits at +0.25% headline and +0.24% core. ING is at +0.3% on both. The difference between +0.2% and +0.3% core is the difference between "December is the last hike" and "December is not the last hike."
The upside risk is visible in the survey data. ISM prices-paid components for both manufacturing and services printed at 73 in October, and S&P Global's PMIs showed the fastest selling-price increases since August 2022, with tariffs, energy, freight and wages all cited. The downside risk is in the labour detail: October payrolls came in at +165,000 against a +65,000 consensus, with unemployment at 4.1% and the prior revised up to 60,000 — strong enough to keep a December hike alive, but not strong enough to settle whether inflation is still accelerating.
77% is a price, not a promise
The December 9 FOMC is now priced at roughly 77% for a 25bp hike, up from 66% before payrolls. That is a market-implied probability, not a policy commitment, and it has already done most of the work in asset prices.
Three levels frame the reaction. On gold, $4,197–4,202 is where the 50- and 100-day moving averages sit; spot traded at $4,107.71 on Monday, so a hot print puts $4,000 back in play and a soft one opens the $4,315.60 double-bottom neckline. On the dollar, DXY at 102.21 is holding above 102; a core print at or below +0.2% would test the lower end of the 101.20–103.20 range that has contained it since late October. On equities, the S&P 500 closed at 7,376.86 on Friday after its worst week since April 2025, and the 10-year at 4.86% is the discount rate that decides whether that bounce holds.
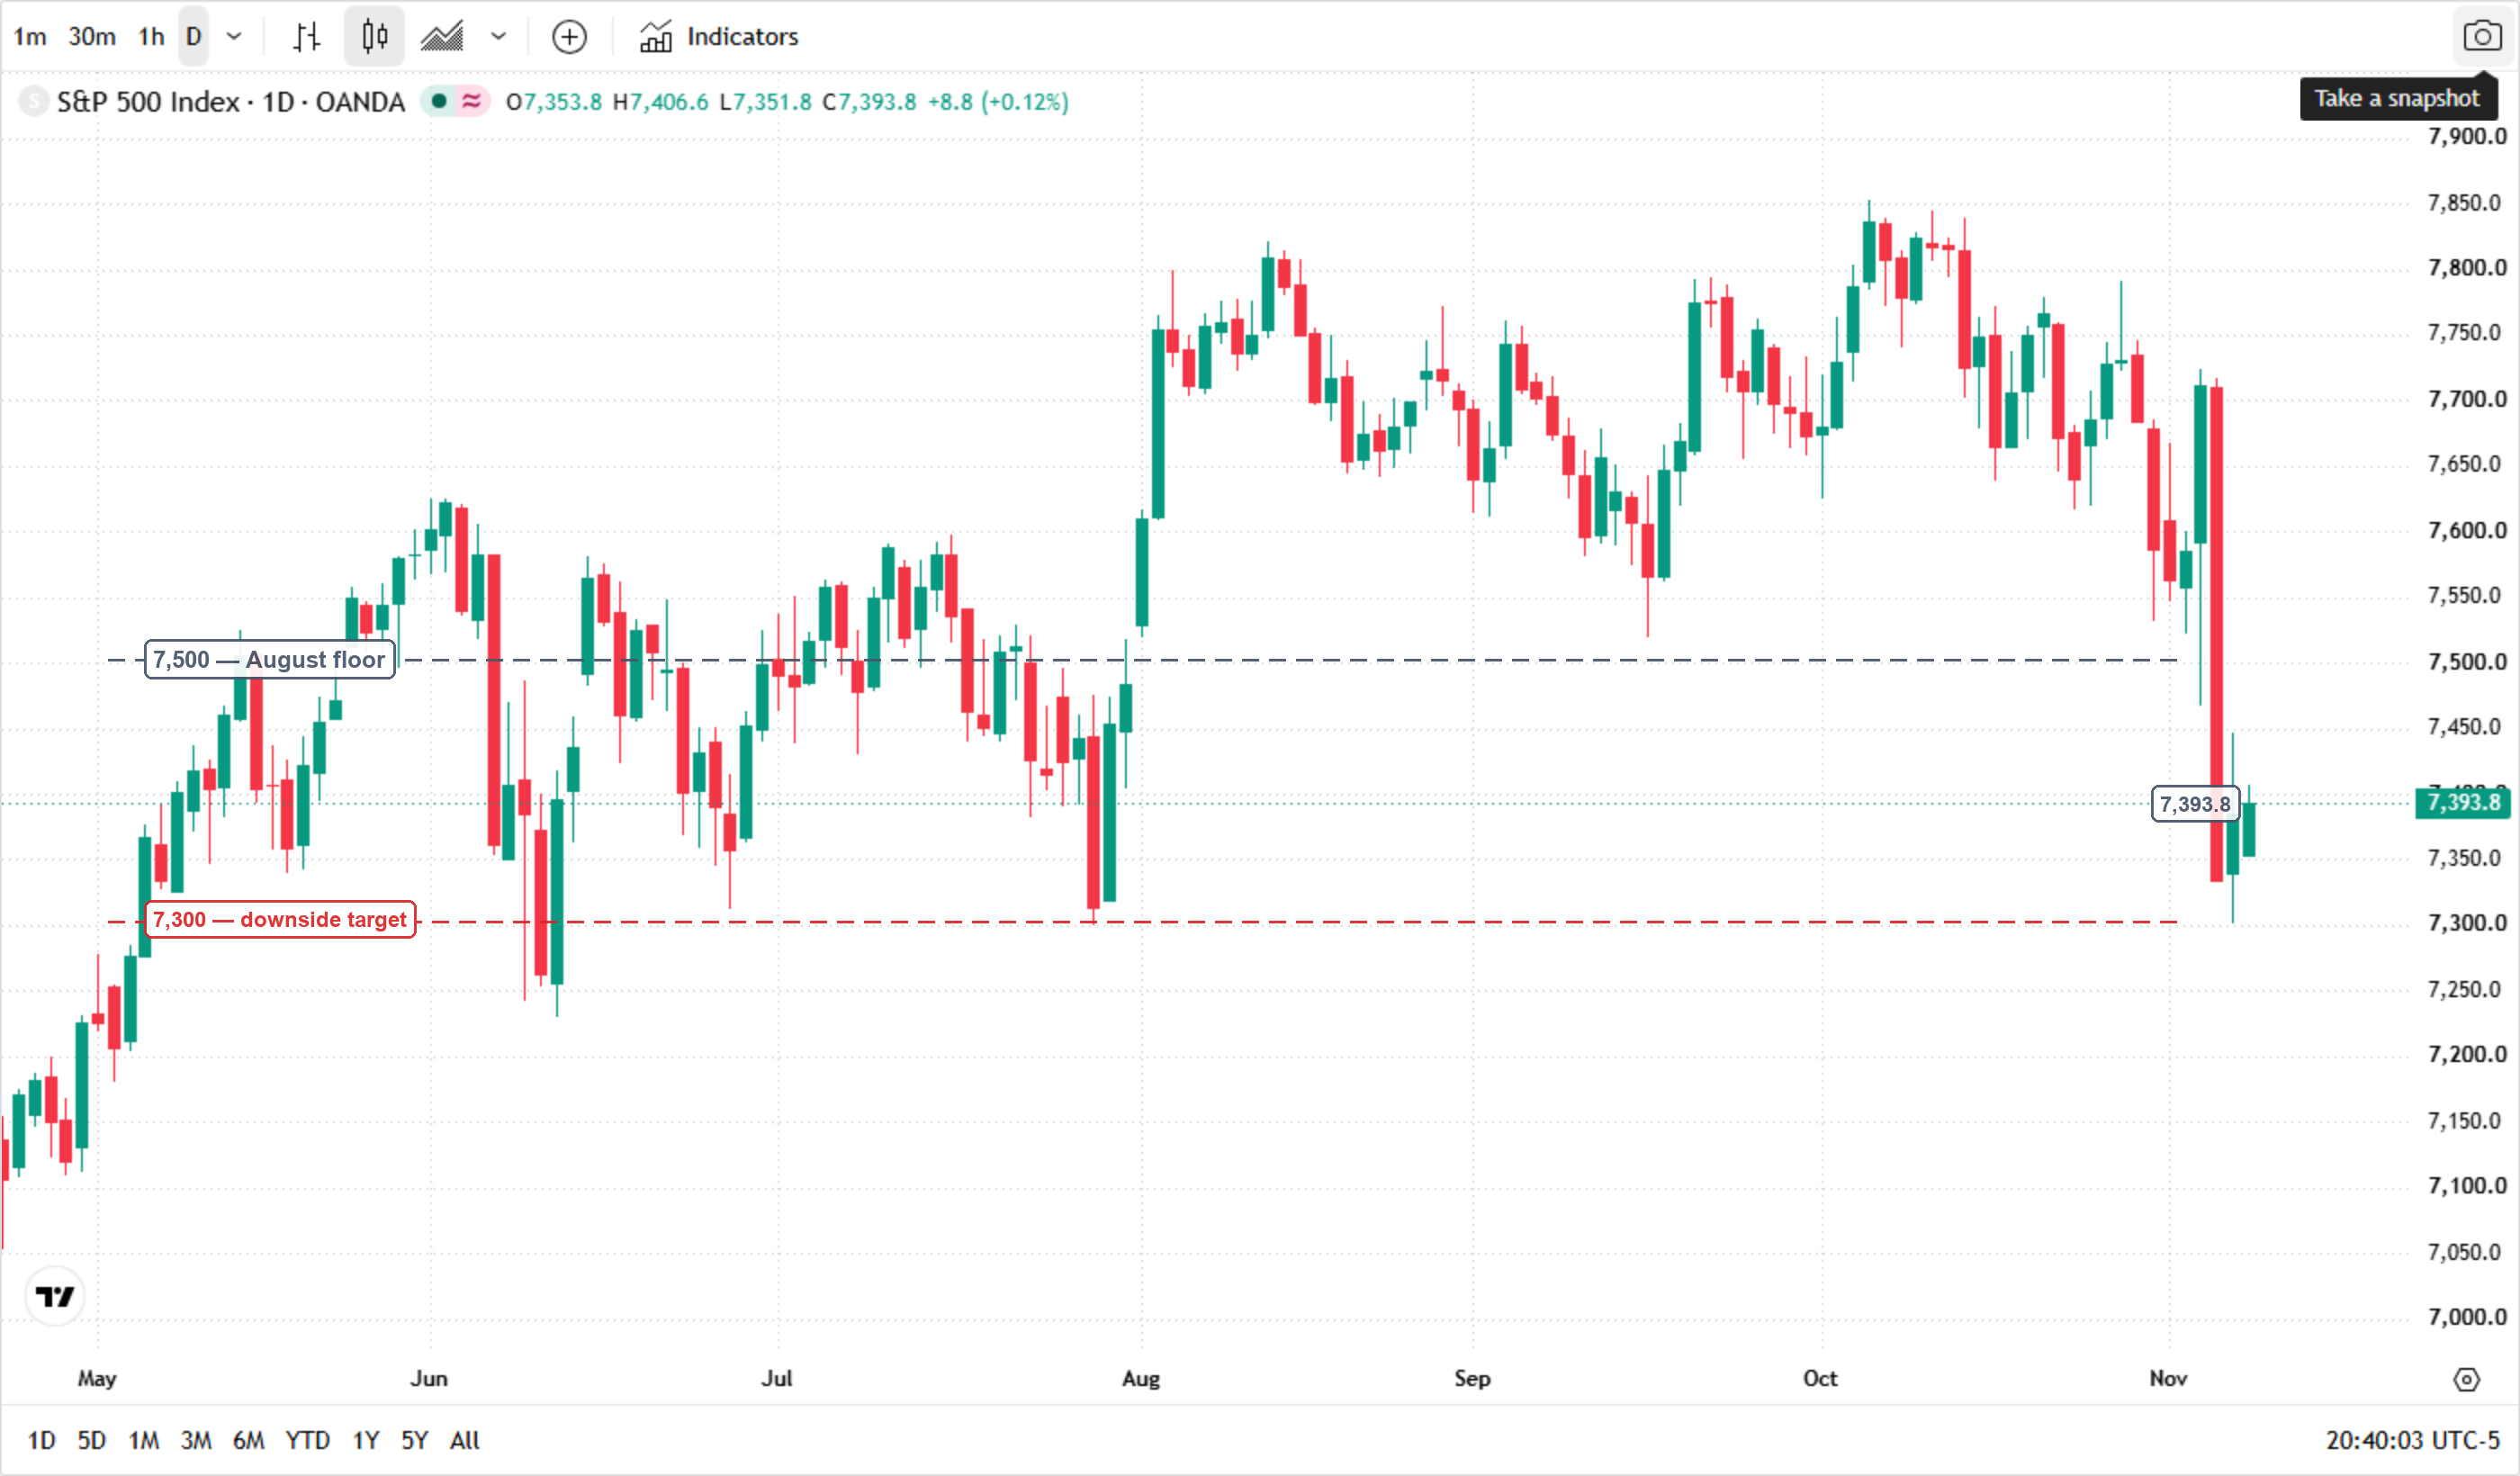
* Chart source: TradingView (OANDA:SPX500USD, daily)
Read the chart at two levels. 7,500 is where every August–October pullback found buyers, and the index spent Friday 26 points below it. 7,300 is the July low; a close under it would confirm that the November selloff is a repricing, not a wobble.
One more calendar item matters: PPI lands on Friday, Nov 13. If CPI is soft and PPI is firm, the "last hike" narrative gets complicated — goods inflation at the pipeline would still be running while consumer prices cool.
The two paths after Tuesday
| Trigger | Direction | First level | Second level |
|---|---|---|---|
| Core CPI m/m ≤ +0.2% | December hike odds fall below 70% | Gold $4,197–4,202; DXY tests 101.20 | Gold $4,315.60; S&P 500 retests 7,500 |
| Core CPI m/m ≥ +0.3% | December hike locks in | Gold $4,000; DXY holds 102 | Gold $3,869.85; S&P 500 tests 7,300 |
| Headline ≥ +0.4% with core +0.3% | "Not the last hike" repricing | 10-year back above 4.95% | US500 7,200; NAS100 24,000 |
| Both ≤ +0.1% | Tail scenario, hike pushed to 2027 | DXY breaks 101.20 | Gold $4,315.60 → $4,540 |
Read more
Before making any trading decisions, it is important to equip yourself with sufficient fundamental knowledge, have a comprehensive understanding of market trends, be aware of risks and hidden costs, carefully consider investment targets, level of experience, risk appetite, and seek professional advice if necessary.
Furthermore, the content of this article is solely the author's personal opinion and does not necessarily constitute investment advice. The content of this article is for reference purposes only, and readers should not use this article as a basis for any investment decisions.
Investors should not rely on this information as a substitute for independent judgment or make decisions solely based on this information. It does not constitute any trading activity and does not guarantee any profits in trading.
If you have any inquiries regarding the data, information, or content related to Mitrade in this article, please contact us via email: insights@mitrade.com. The Mitrade team will carefully review the content to continue improving the quality of the article.


