


Applied Materials Stock Bounces 11% Into Earnings, With $410.79 the First Hurdle
TradingKey - Applied Materials (NASDAQ: AMAT) jumped 11.37% to $370.55 on Monday, November 9, and overnight trading held near $368.42. The rebound followed a drop of about 16% the week before in the post-midterm chip selloff, and the stock is still about 25.5% below its $497.53 close on October 12, the day before its investor day.
The real test comes on Thursday, November 12, when AMAT reports fiscal Q4 results after the close. It is the first major chip equipment maker to report since the November 5 crash, so investors will treat it as a check on AI-driven spending on chip factories.
What Wall Street Expects on Thursday
AMAT guided Q4 revenue to $10.25 billion, plus or minus $500 million, and non-GAAP EPS, which leaves out items such as stock-based pay, to $4.02, plus or minus $0.20. Analysts expect about $10.30 billion and $4.06, up roughly 51% and 87% from $6.80 billion and $2.17 a year earlier, according to TipRanks.
That would build on a record fiscal Q3, when revenue rose 25% to $9.12 billion and non-GAAP EPS rose 41% to $3.50. For fiscal Q1 2027, consensus sits near $10.83 billion, while UBS expects $10.95 billion.
Why AMAT Is Still 25% Below Its Investor Day Level
At its investor day at SEMICON West on October 13, AMAT set 2030 targets for a non-GAAP gross margin, the share of revenue left after production costs, of about 54% and an operating margin of about 40%. It also aims to gain more than 2 percentage points of share in wafer fab equipment (WFE), the machines used to make chips. But CEO Gary Dickerson gave no WFE forecast, and the stock fell 6.7% that day.
Then on November 5, the PHLX Semiconductor Index, a benchmark of major chip stocks, fell 12.25%, its worst day since March 2020, as some investors worried about tougher AI rules and state pushback on data centers after the midterm elections. Lam Research announced a $25 billion buyback that same day, and it still did not stop the selling.
What Drove Monday's Rally
Monday's rebound was led by chip equipment stocks, as Lam Research and KLA rose about 9% each and ASML gained about 6%. Lam expects WFE spending in the mid-$150 billion range for 2026 and above $200 billion for 2027, and Citi's Atif Malik, who rates AMAT a Buy, sees $224 billion in 2027 and $286 billion in 2028.
Valuation gave buyers another reason, since AMAT trades at about 18 times the earnings analysts expect over the next 12 months, the lowest of the four equipment leaders, against 19 for Lam, 22 for KLA and 24 for ASML, and down from nearly 49 times in late June.
The Real Questions for Thursday
Supply limits are the main worry going into the report, but UBS's Timothy Arcuri, who rates the stock a Buy with a $695 target, does not expect supply issues to have "a material impact" on guidance and calls near-term shipment disruptions "noise rather than a change in the strength of underlying WFE demand." China is the other risk, at 28% of fiscal Q3 revenue, down from 35% a year earlier.
In my view, a beat is largely expected, so the stock will move on whether AMAT finally gives numbers for 2027 and whether gross margin moves above Q3's 50.4%.
Applied Materials Technical Analysis: Daily Close Above $410.79 Could Open $473.42
On the daily chart, buyers stepped in right at $317.34, the lower edge of the falling channel, two parallel downward-sloping lines that have contained price since July. A bounce from the channel floor is a constructive sign, and sellers would now need a close below it to restart the slide. Still, the bigger trend remains down, with lower highs since the July peak, and Thursday's report will add volatility.
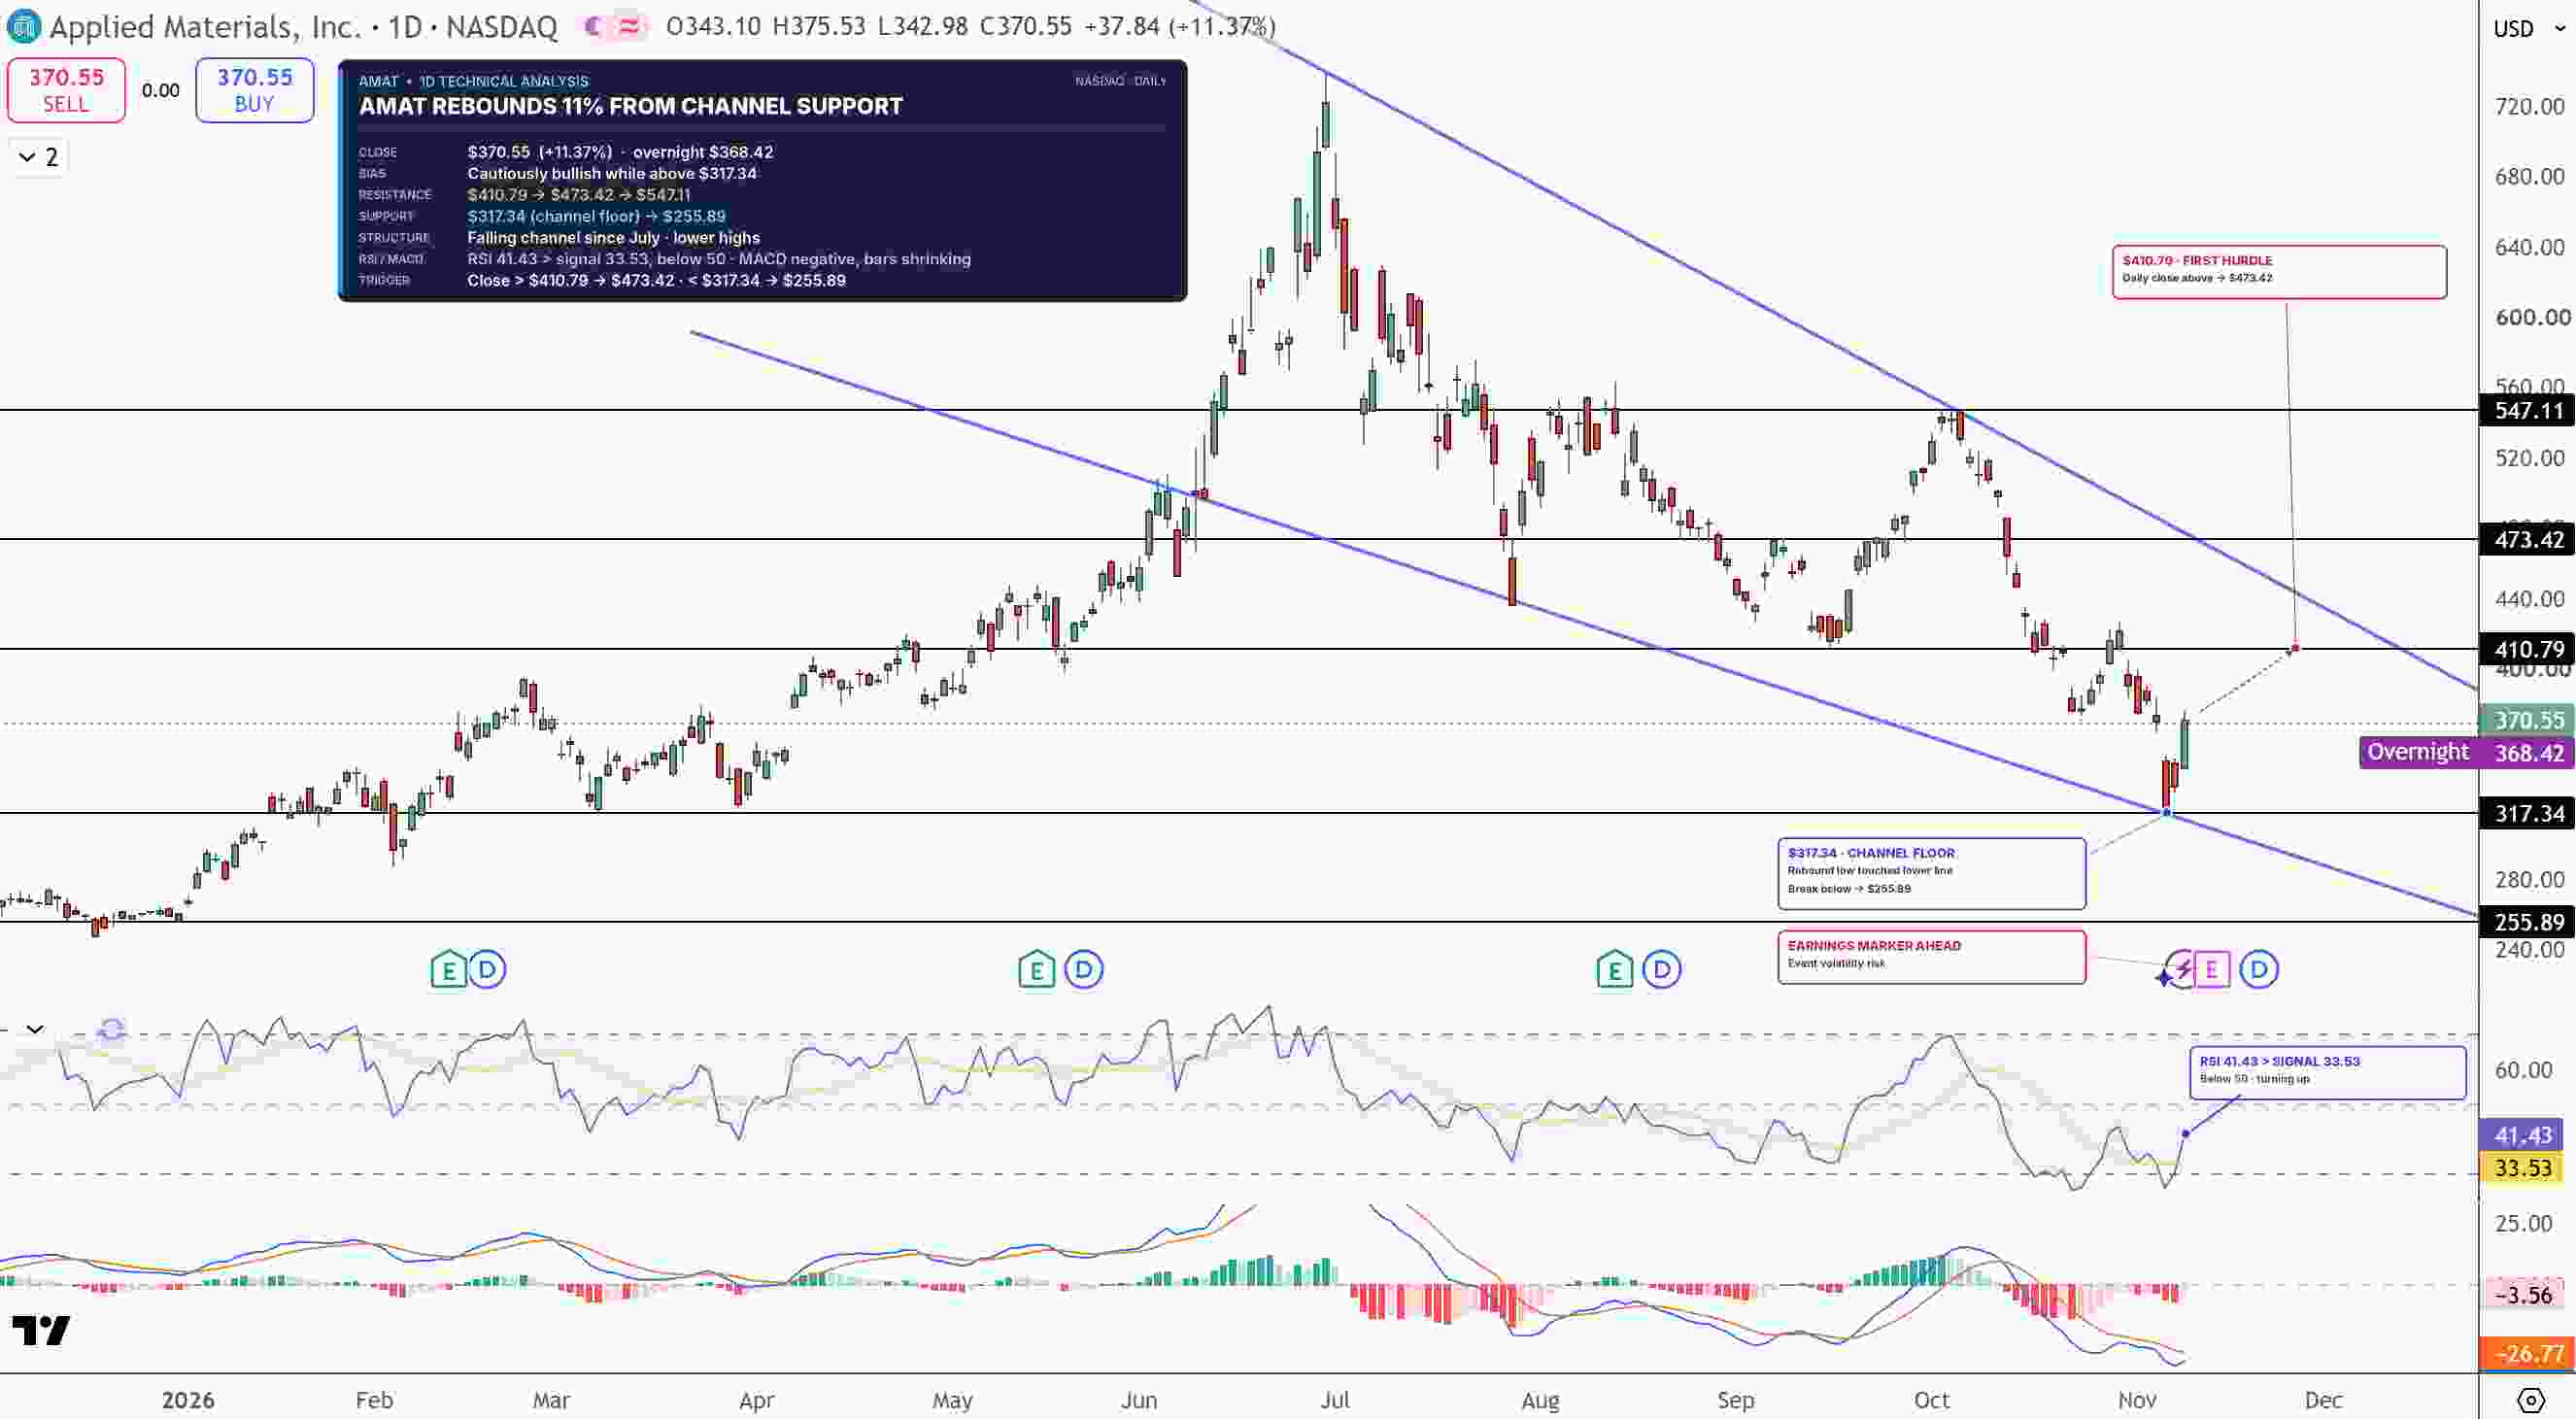
Applied Materials Stock Price Chart - Source: Tradingview
RSI, a momentum gauge that runs from 0 to 100, has climbed to about 41 after nearly reaching 30, the oversold line. The MACD, a trend-following momentum indicator, is still negative, but its bars are shrinking, so selling pressure is easing.
The first hurdle is $410.79. A daily close above it could open the way for $473.42. On the downside, a drop below $317.34 would break the channel floor and could send AMAT toward $255.89.
I'm cautiously bullish in the short term while AMAT holds above $317.34, with $410.79 as the first target.
Key Levels
- Last close: $370.55, up 11.37% on Monday, November 9 (overnight: $368.42)
- Support: $317.34, $255.89
- Resistance: $410.79, $473.42
- RSI: 41.43, below the 50 midline
- Bullish trigger: Daily close above $410.79
- Bearish trigger: Daily close below $317.34
FAQs
When does Applied Materials report earnings?
Applied Materials reports fiscal Q4 2026 results after the close on Thursday, November 12. Analysts expect revenue of about $10.30 billion and non-GAAP EPS of $4.06, against company guidance of $10.25 billion and $4.02.
What is the Applied Materials stock forecast now?
The bias is cautiously bullish in the short term while AMAT holds above $317.34 on the daily chart. A daily close above $410.79 could open $473.42, while a drop below $317.34 could send it toward $255.89.
Bottom Line
Applied Materials has bounced off its channel floor, but it stays in a downtrend until it clears $410.79. I expect a push toward that level if Thursday's report finally brings numbers for 2027, while a daily close below $317.34 would end the bounce and open $255.89.
Recommended Articles


