


Crypto Today: Bitcoin, Ethereum, XRP extend decline with US CPI in focus
- Bitcoin corrects below $75,000 on Tuesday ahead of US CPI report.
- Ethereum ticks lower near $2,100 as downtrending momentum indicators weigh.
- XRP falls for the sixth consecutive day and trades below $1.10 amid a heavily capped upside.
Cryptocurrency prices face increasing selling pressure on Tuesday, with Bitcoin (BTC) trading below $75,000, Ethereum (ETH) edging lower toward $2,100, and Ripple (XRP) hovering beneath the immediate $1.10 cap.
US CPI data in focus amid fading risk appetite
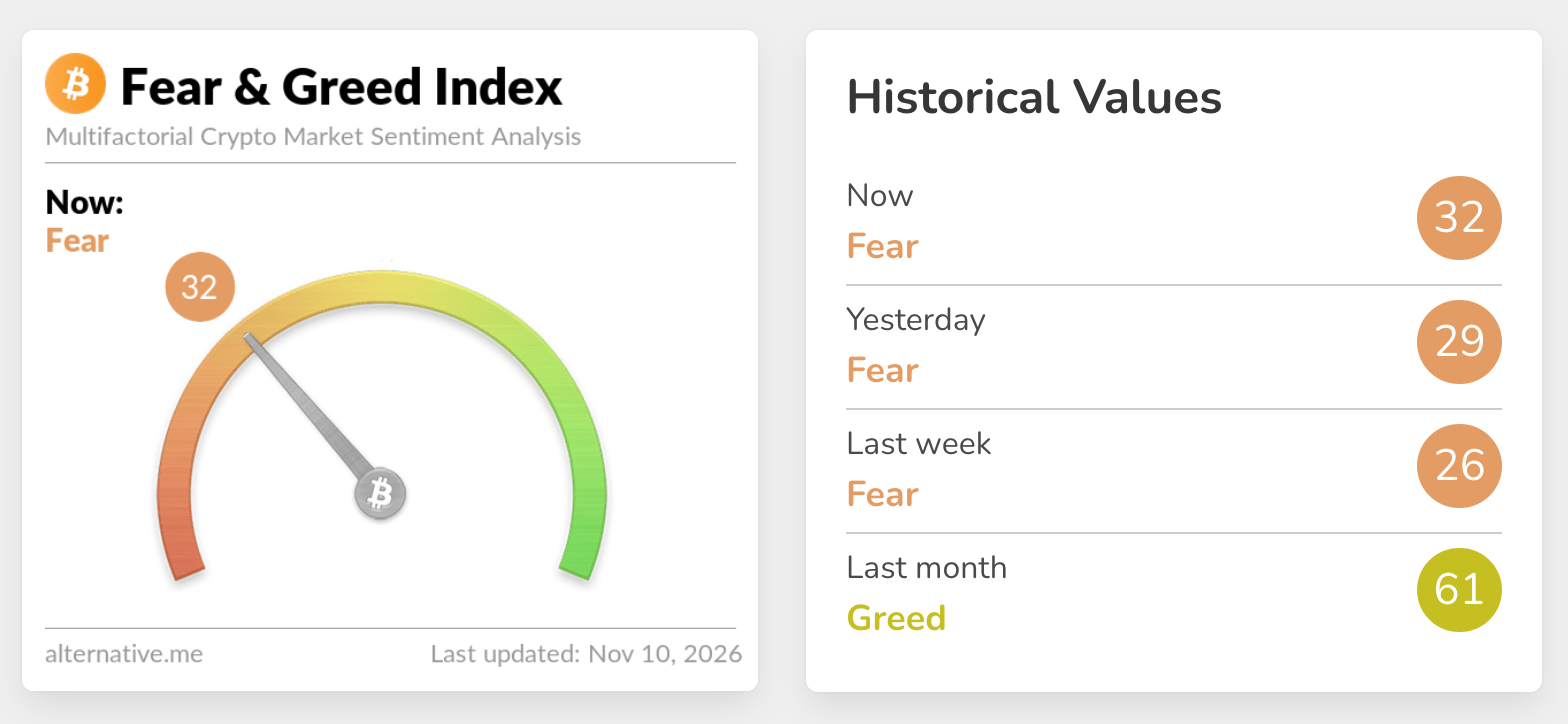
Interest in crypto-related digital investment products has taken a persistent back seat, with the Fear & Greed Index at 32 in the Fear territory on Tuesday, up slightly from 29 in the same range the previous day. More broadly, the index has corrected from 61 in the Greed territory last month, reinforcing risk-off sentiment.
The broader crypto market looks ahead to the United States (US) Consumer Price Index (CPI) report, which the Bureau of Labor Statistics (BLS) will release later on Tuesday. This key inflation indicator helps the Federal Reserve (Fed) shape monetary policy.
Economists surveyed by Dow Jones and Bloomberg expect CPI to rise 0.3% in October. Core CPI, excluding volatile food and energy prices, is predicted to rise 0.2% from the previous month.
The inflation report comes ahead of the Fed December interest rate decision, which market participants broadly expect a 25 basis-point interest after keeping rates unchanged in the 3.75-4.00% range in October.
Technical analysis: Bitcoin slips below $75K as bearish grip intensifies
Bitcoin trades at $74,743, extending a corrective phase with a bearish near-term bias as price holds below the main Exponential Moving Averages (EMAs). The 200-day EMA at $76,457, the 100-day EMA near $77,575 and the 50-day EMA around $79,141 all sit overhead, suggesting the broader uptrend structure is being challenged, while the SuperTrend line at $81,375 further reinforces a cap.
Momentum remains weak, with the Relative Strength Index (RSI) hovering near 36 and the Moving Average Convergence Divergence (MACD) still negative, suggesting downside pressure is not yet exhausted despite intermittent bounces.
Initial resistance lies at the 200-day EMA around $76,457, followed by the 100-day EMA at $77,575, where a sustained break would be needed to ease immediate selling pressure. Further up, the 50-day EMA near $79,141 and the SuperTrend barrier at $81,375 form a broader supply zone that would likely limit rallies unless buyers regain clear control.
With no notable support levels on the daily chart, failure to reclaim these overhead averages keeps risks skewed toward further weakness or a retest of lower price levels toward $70,000.
"Should the macro backdrop improve, we would expect BTC to retest $76,300 first, followed by $78,700. On the downside, the market remains fragile, with limited support below $73,700," Crypto Finance said in an emailed analysis report, adding, "A break lower would bring the August 2026 levels back into focus, with the psychological $70,000 mark the key level to watch."
Ethereum technical analysis: ETH bears retain control
Ethereum trades at $2,113, keeping a clear bearish near‑term bias as price holds beneath the upward-sloping support trendline’s break point at $2,229 and stays well below the 200-day EMA at $2,301. The 100-day and 50-day EMAs, at $2,333 and $2,361 respectively, along with the SuperTrend resistance near $2,391, collectively suggest that rallies are likely to be capped while MACD remains in negative territory and the RSI hovers just above oversold conditions, hinting at persistent downside pressure despite a risk of short-covering bounces.
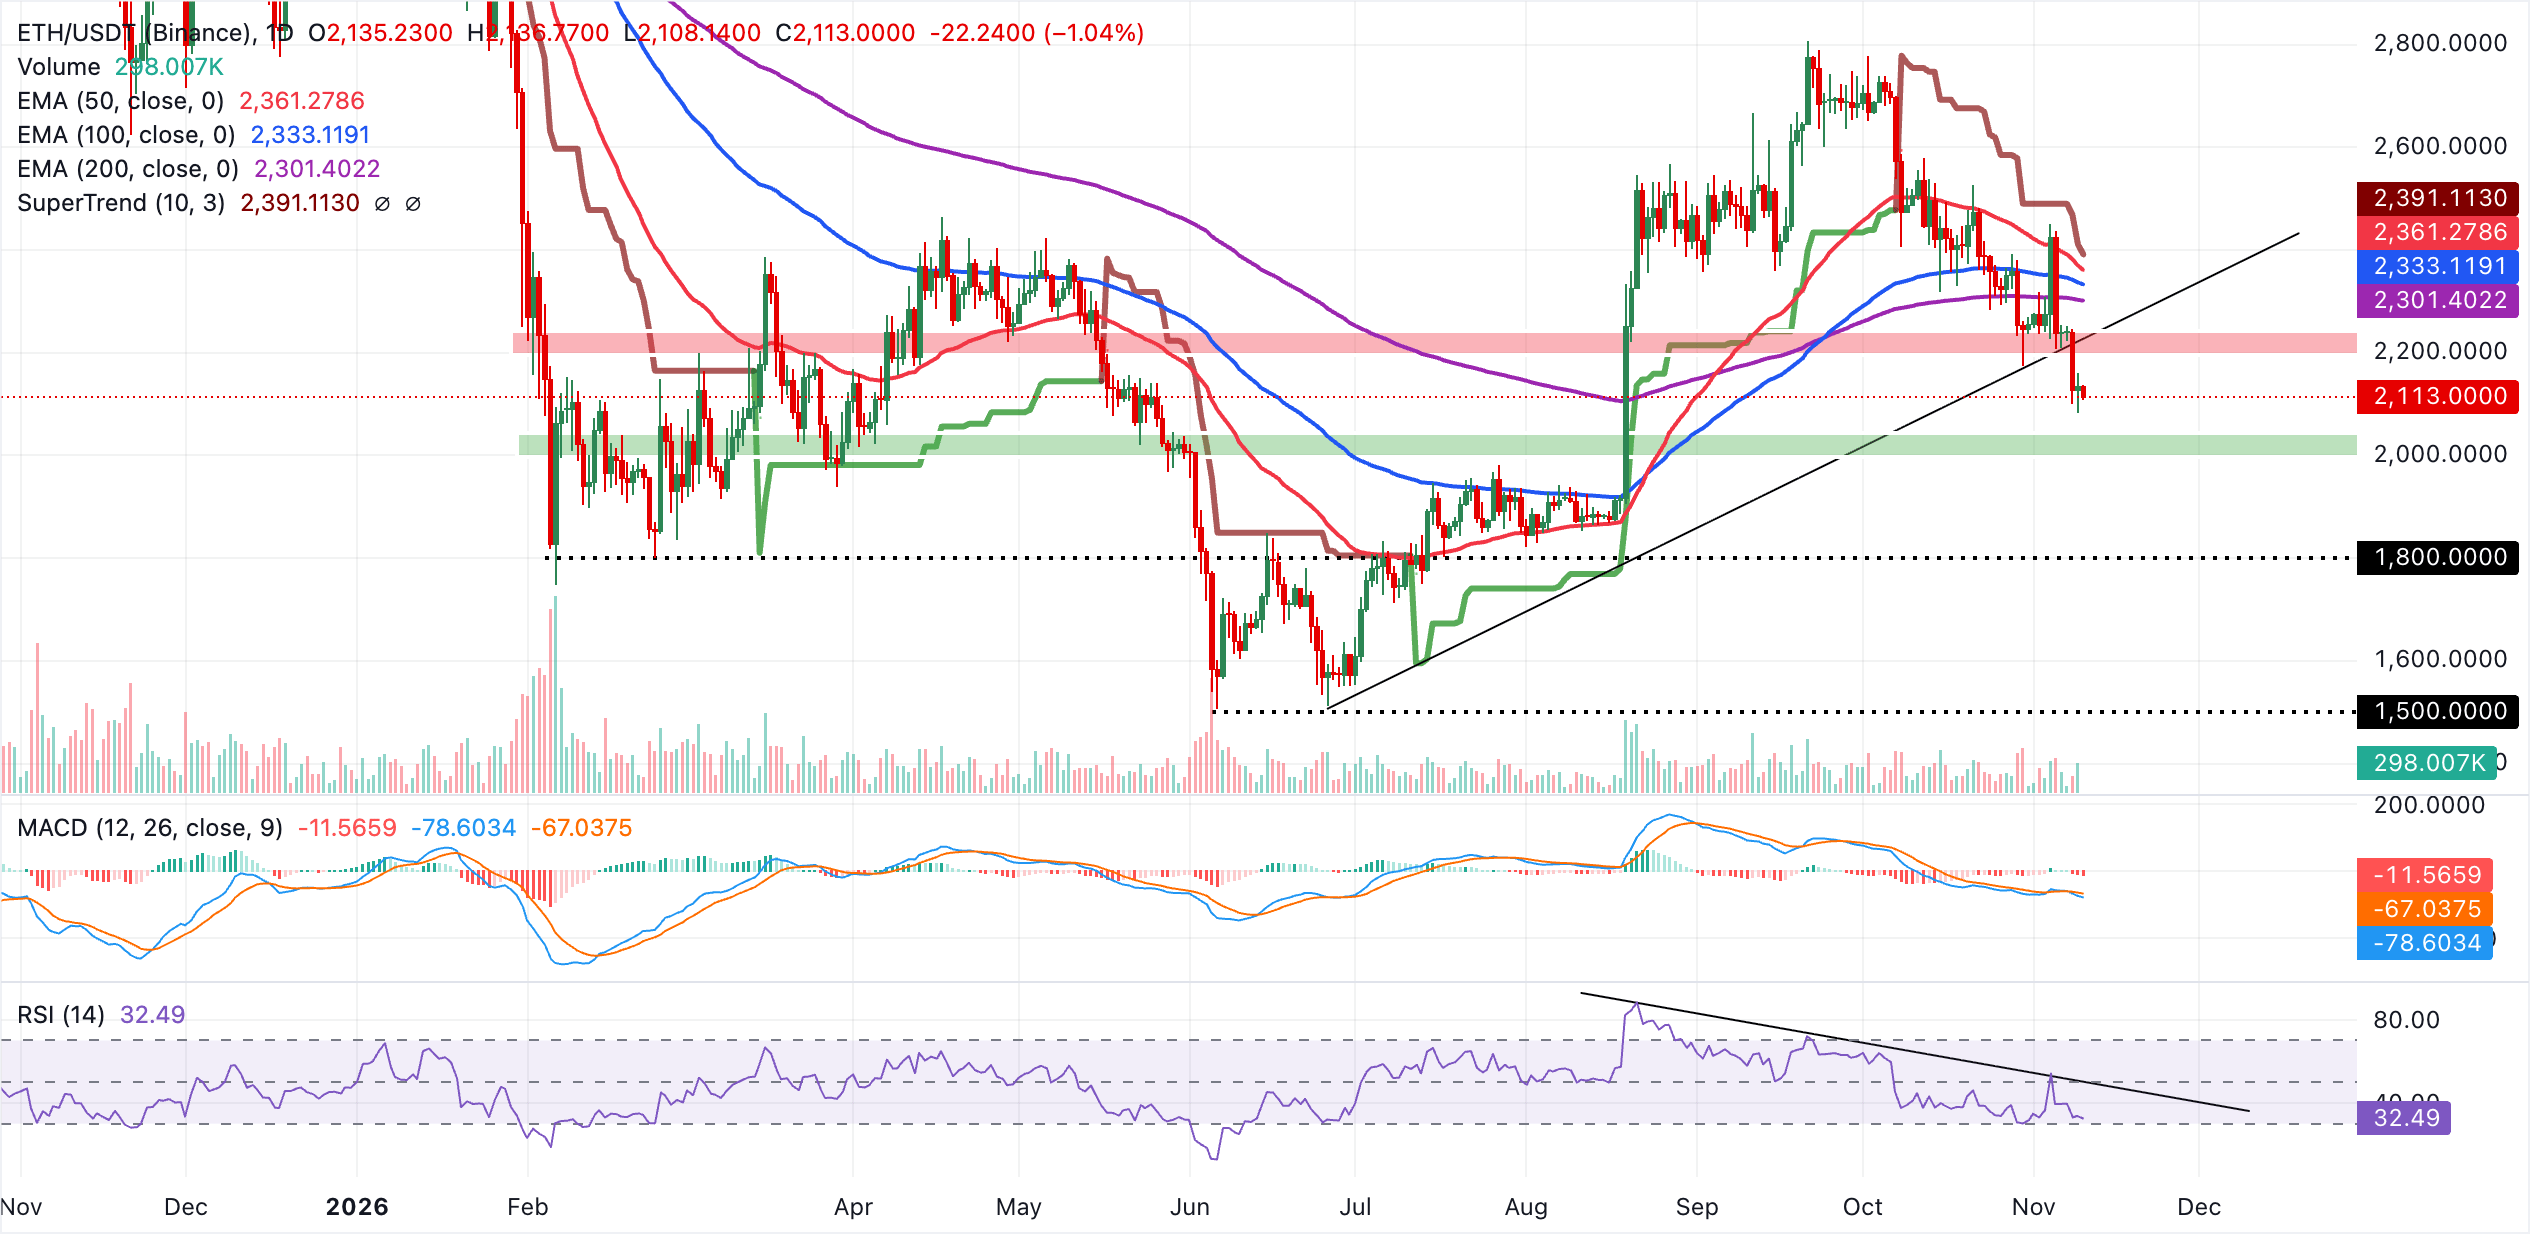
Initial resistance appears at the broken trendline level around $2,229, ahead of the 200-day EMA at $2,301. A sustained move above these would be needed to ease the prevailing bearish tone and expose the 100-day EMA at $2,333 and the 50-day EMA at $2,361, before the more distant SuperTrend barrier at $2,391.
On the downside, with no nearby structural levels from the studied indicators beneath the market, the latest low around the current price area becomes a provisional floor, and a decisive break under $2,113 would open the door to a deeper slide, keeping ETH vulnerable while it trades under all major moving averages and trend resistance.
Technical analysis: XRP faces persistent downtrend
XRP trades at $1.09, extending a bearish bias as price holds well below the clustered EMAs and the active SuperTrend line. The 50-day EMA at $1.29, the 100-day EMA at $1.30 and the 200-day EMA at $1.35 all sit overhead, reinforcing a capped tone, while the SuperTrend at $1.26 adds to the ceiling.
Momentum remains weak, with the MACD below zero, while the RSI at 26 slips into oversold territory, suggesting selling pressure is stretched but not yet reversed.
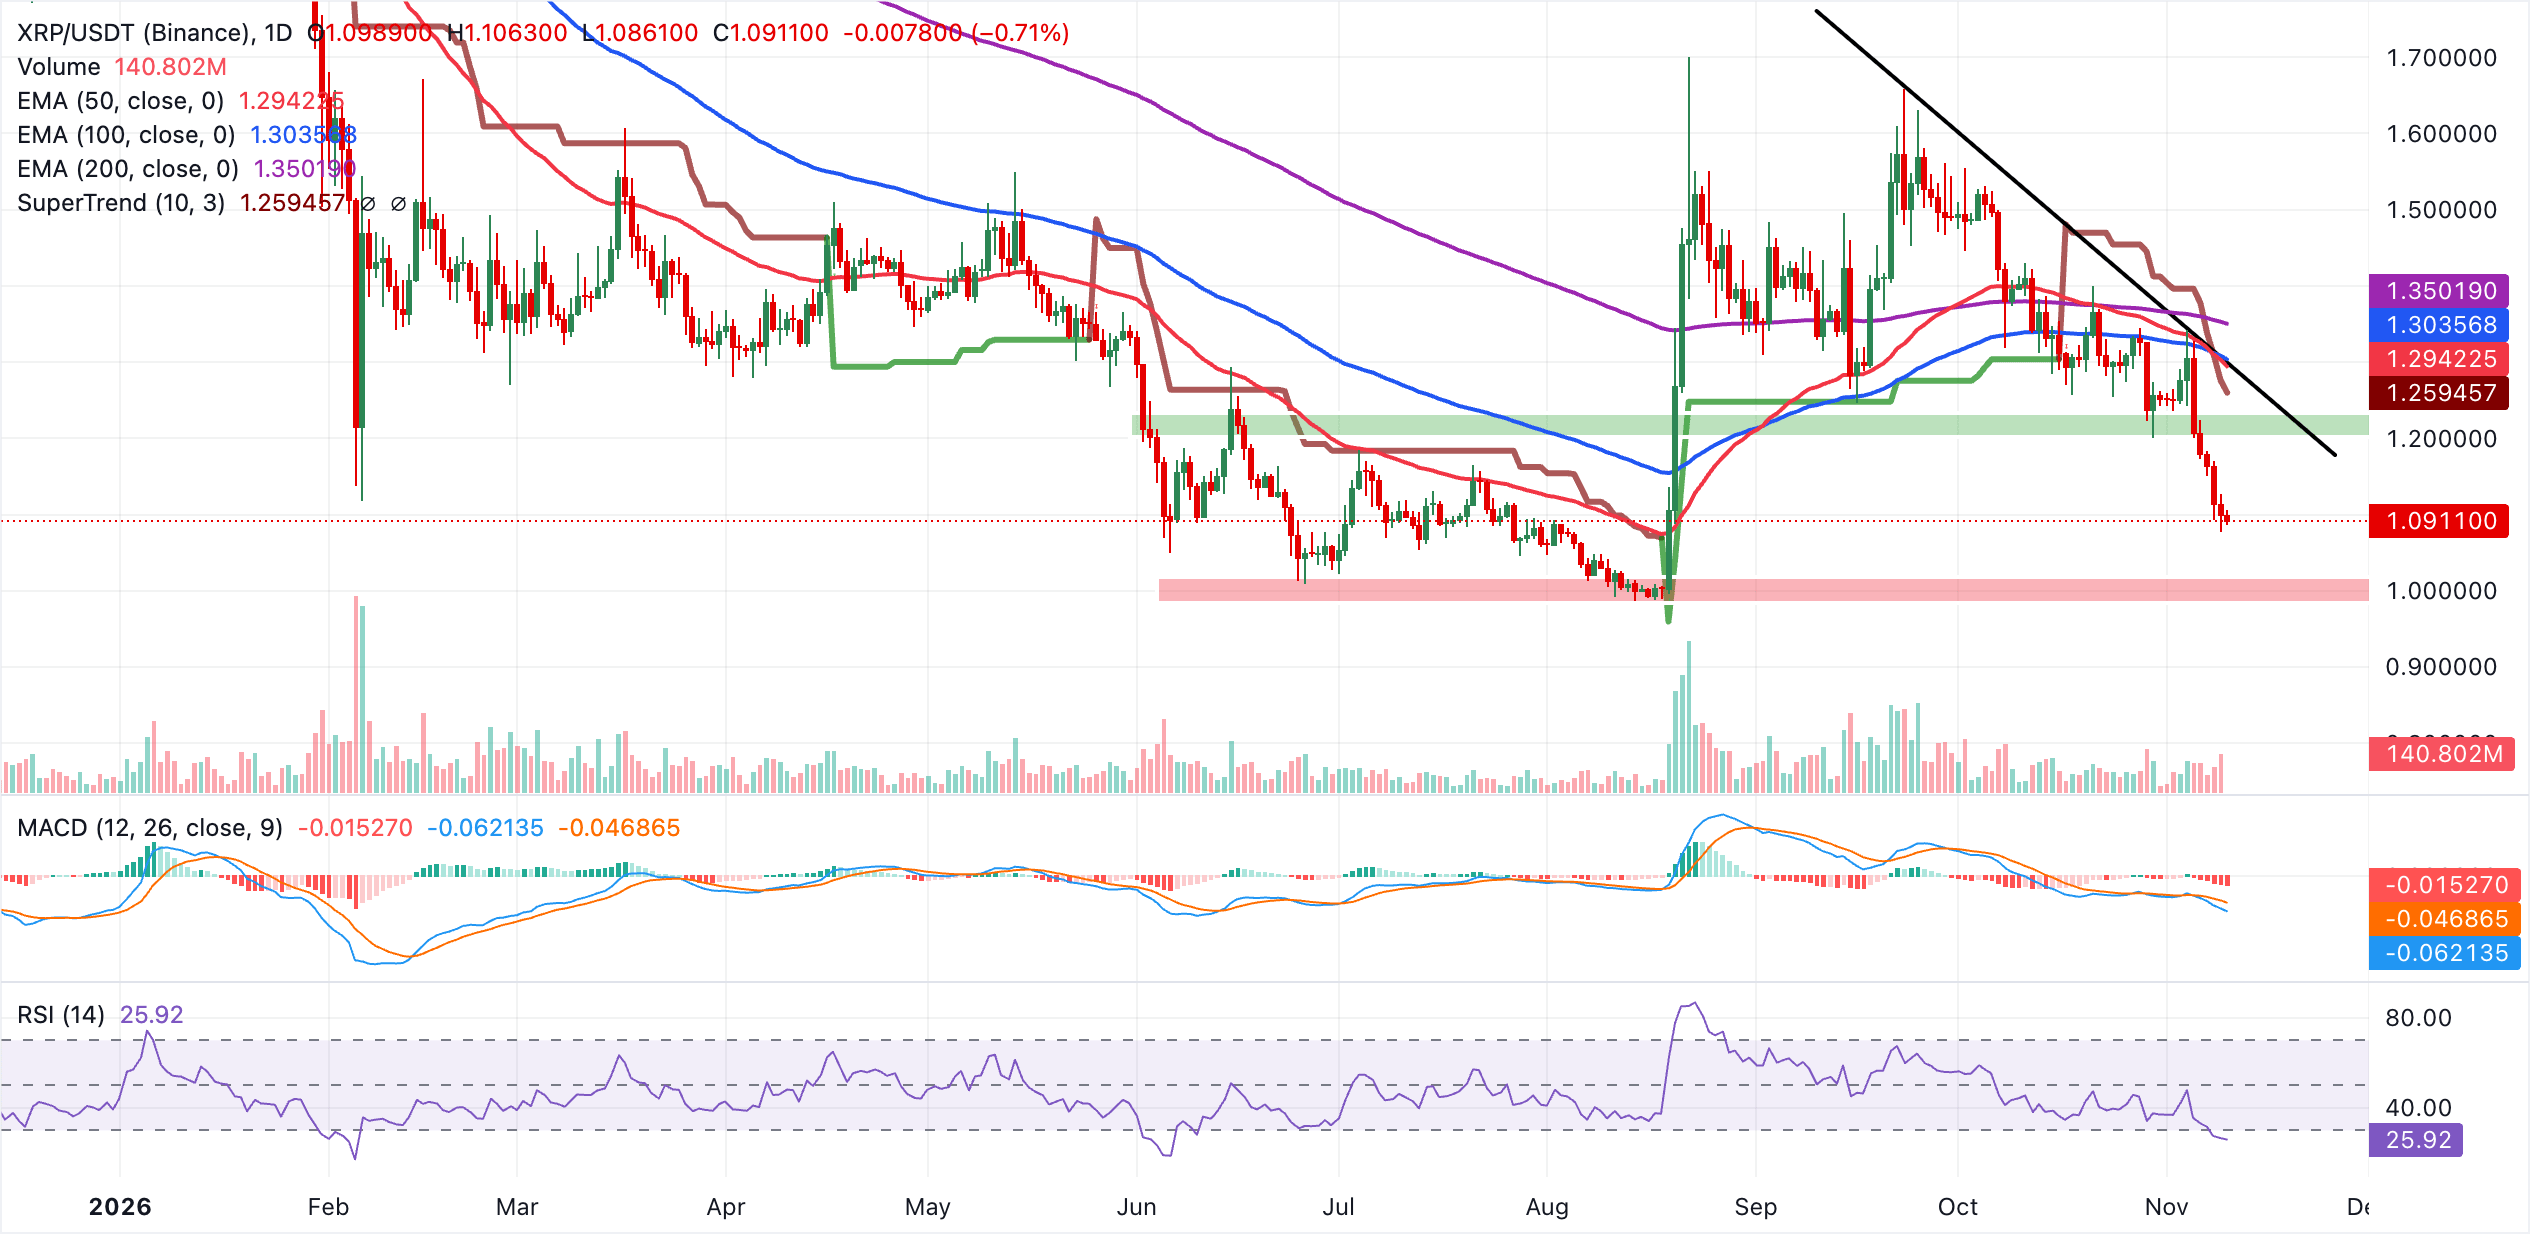
Initial resistance emerges at the SuperTrend level around $1.26, ahead of a dense structural band formed by the 50-day EMA at $1.29 and the downward resistance trendline break point at $1.30. Further up, the 100-day EMA at $1.30 is followed by the 200-day EMA near $1.35, which marks a more significant barrier to any sustained recovery.
With no nearby support levels in the current indicator set, the pair remains vulnerable under this stacked resistance complex, and any rebound would likely struggle as it approaches the $1.26-$1.30 region defined by the first overhead technical hurdles.
(The technical analysis of this story was written with the help of an AI tool. Know more.)
Bitcoin, altcoins, stablecoins FAQs
Bitcoin is the largest cryptocurrency by market capitalization, a virtual currency designed to serve as money. This form of payment cannot be controlled by any one person, group, or entity, which eliminates the need for third-party participation during financial transactions.
Altcoins are any cryptocurrency apart from Bitcoin, but some also regard Ethereum as a non-altcoin because it is from these two cryptocurrencies that forking happens. If this is true, then Litecoin is the first altcoin, forked from the Bitcoin protocol and, therefore, an “improved” version of it.
Stablecoins are cryptocurrencies designed to have a stable price, with their value backed by a reserve of the asset it represents. To achieve this, the value of any one stablecoin is pegged to a commodity or financial instrument, such as the US Dollar (USD), with its supply regulated by an algorithm or demand. The main goal of stablecoins is to provide an on/off-ramp for investors willing to trade and invest in cryptocurrencies. Stablecoins also allow investors to store value since cryptocurrencies, in general, are subject to volatility.
Bitcoin dominance is the ratio of Bitcoin's market capitalization to the total market capitalization of all cryptocurrencies combined. It provides a clear picture of Bitcoin’s interest among investors. A high BTC dominance typically happens before and during a bull run, in which investors resort to investing in relatively stable and high market capitalization cryptocurrency like Bitcoin. A drop in BTC dominance usually means that investors are moving their capital and/or profits to altcoins in a quest for higher returns, which usually triggers an explosion of altcoin rallies.
Recommended Articles


