

Pi Network Price Forecast: PI rebounds from record lows, exits oversold territory as momentum improves

Source Fxstreet
  • Pi Network is up around 7% on Tuesday after hitting a record low of $0.0624 the previous day.
  • Pi futures Open Interest rises to $6.21 million, pointing to increased positioning in the derivatives market.
  • The technical outlook for PI is mixed, with the daily RSI recovering above 30 after entering oversold territory.

Pi Network (PI) shows a strong recovery on Tuesday, up over 7% after recording its all-time low of $0.0624 the previous day. PI token’s appeal in the derivatives market shows minor improvement, with Open Interest rising to $6.21 million. The technical outlook for PI remains mixed, with the price still capped below a long-term resistance trendline. 

Recovering Open Interest eases short-term risk

Pi Network shows signs of regaining ground in the derivatives market. Blockworks data shows the PI token Open Interest (OI) rises to $6.21 million, from $5.89 million the previous day, indicating a near-term positional buildup and a firm rebound in sentiment. 
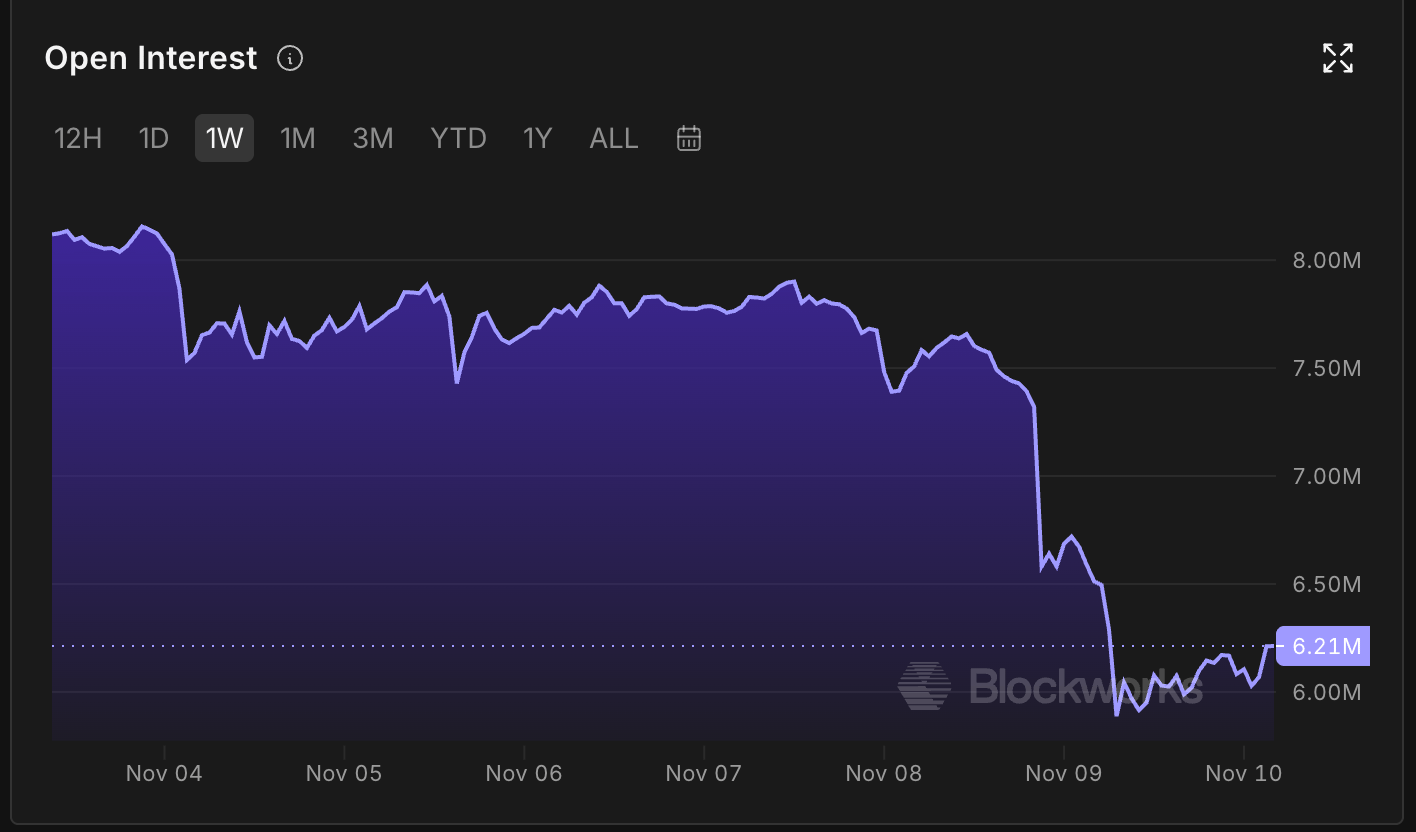
PI token Open Interest chart. Source: Blockworks

Technical outlook: Can PI regain lost levels?

Pi Network trades at $0.0703 at press time on Tuesday, reflecting a rebound after five straight days of losses. The price holds well below the 50-day and 200-day Exponential Moving Averages (EMAs) at $0.0799 and $0.1085, respectively, and is capped by a long-term resistance trendline connecting the June 20 and August 22 highs at around $0.0752. A sustained recovery in PI could face its initial resistance at the descending trendline near $0.0752, followed by the 50-day EMA at $0.0799.

The Relative Strength Index (RSI) around 35 suggests weakness but also a rebound from oversold conditions, while the Moving Average Convergence Divergence (MACD) remains in negative territory, hinting that downside momentum could still outweigh recovery attempts.

Chart Analysis PI/USD (baha Crypto)
PI/USD daily price chart.

Looking down, the immediate support for PI aligns with the 127.2% Fibonacci extension level, measured over the downswing from $0.1394 to $0.0704, at $0.0516.

(The technical analysis of this story was written with the help of an AI tool. Know more.)

Disclaimer: For information purposes only. Past performance is not indicative of future results.
placeholder
Weekly Report: Gold up 4.5%, Brent down 16.4% — three commodity regimes just resetGold rose 4.51% to $4,074.90 while Brent fell 16.42% to $98.32 in the same five sessions — two inflation hedges, opposite answers. Around them, the gold-silver ratio sits at 78.7 and copper fell 3.72%. Three regime signals, two of them close to flipping, define what commodity traders must re-price before Tuesday's CPI.
Author  Irene Q.
Yesterday 03: 05
Gold rose 4.51% to $4,074.90 while Brent fell 16.42% to $98.32 in the same five sessions — two inflation hedges, opposite answers. Around them, the gold-silver ratio sits at 78.7 and copper fell 3.72%. Three regime signals, two of them close to flipping, define what commodity traders must re-price before Tuesday's CPI.
placeholder
The CPI that has no year-over-year number is the one that decides DecemberOctober CPI lands on Nov 10 at 13:30 GMT, and it will be published without a year-over-year figure: BLS never collected October 2025 prices during the federal shutdown. Consensus is +0.3% headline and +0.2% core month-on-month, against +0.6% and +0.3% in September. With December hike odds at 77%, the month-on-month print is now the whole story, and $4,197–4,202 on gold and 4.86% on the 10-year are the levels that price it.
Author  Irene Q.
Yesterday 03: 23
October CPI lands on Nov 10 at 13:30 GMT, and it will be published without a year-over-year figure: BLS never collected October 2025 prices during the federal shutdown. Consensus is +0.3% headline and +0.2% core month-on-month, against +0.6% and +0.3% in September. With December hike odds at 77%, the month-on-month print is now the whole story, and $4,197–4,202 on gold and 4.86% on the 10-year are the levels that price it.
placeholder
US October CPI Preview: Inflation Growth May Slow, How Will US Stocks, Dollar and Gold React? On Tuesday (Nov. 10) Eastern Time, the U.S. will release the October Consumer Price Index (CPI), a key inflation reading ahead of the Federal Reserve's December interest rate decision. Th
Author  TradingKey
Yesterday 08: 08
On Tuesday (Nov. 10) Eastern Time, the U.S. will release the October Consumer Price Index (CPI), a key inflation reading ahead of the Federal Reserve's December interest rate decision. Th
placeholder
Gold Price Analysis Today | Forex Gold Analysis | XAU/USD Analysis - November 10, 2026Get the latest gold price analysis, forex gold insights, and XAU/USD analysis for November 10, 2026. Read on for the details.
Author  Mitrade
9 hours ago
Get the latest gold price analysis, forex gold insights, and XAU/USD analysis for November 10, 2026. Read on for the details.
placeholder
Nvidia fell 4.3% on a day the Nasdaq rose 2.7% — this is a governance discount, not an AI warningNvidia closed at $178.67 on November 9, down 4.27% with an intraday low of $170.24, while the Nasdaq rose 2.74% and the Philadelphia Semiconductor Index jumped 6.85%. Volume was roughly 2.5 times the prior session. The board opened an independent review after CEO Jensen Huang's public statement about his personal life. With Q3 earnings on November 17, the two levels that matter are $170.24 and $200."
Author  Irene Q.
8 hours ago
Nvidia closed at $178.67 on November 9, down 4.27% with an intraday low of $170.24, while the Nasdaq rose 2.74% and the Philadelphia Semiconductor Index jumped 6.85%. Volume was roughly 2.5 times the prior session. The board opened an independent review after CEO Jensen Huang's public statement about his personal life. With Q3 earnings on November 17, the two levels that matter are $170.24 and $200."
goTop
quote