


ARM Stock Price Forecast: Stock Hits 6-Month Low After Earnings, $180 Becomes Key Support for Bulls
TradingKey - As of the close on November 4 Eastern Time, Arm (ARM) shares fell 5.28% to close at $191.80. After Arm released its latest financial report, its stock fell further by about 2.6% in after-hours trading to trade around $186.90. Although the company's second-fiscal-quarter revenue and adjusted earnings per share both exceeded market expectations, royalty revenue performed relatively weakly, while next-quarter guidance was only slightly above analyst forecasts, leading the market to reprice its future growth pace.
Revenue Rises 27% as Licensing Business Beats Expectations
According to the latest financial report, ARM's second-quarter revenue for fiscal 2027 reached $1.44 billion, up 27% year-over-year, exceeding market expectations of approximately $1.38 billion; adjusted earnings per share were $0.52, also above market forecasts of around $0.47.
By business segment, license and other revenue reached $773 million, significantly above market expectations and serving as a major source of the quarterly upside beat. By contrast, royalty revenue stood at $670 million, up 8% year-over-year but falling short of market forecasts. Since royalty revenue primarily reflects the volume of shipped Arm-architecture chips, its relatively slower growth rate became a key focus area after the report.
AI data centers remain a fast-growing area for ARM. The company stated that Arm architecture accounted for over half of server deployments among major cloud service providers in 2025, and projects this share could exceed 60% by the end of 2026. Google has also begun adopting Arm-based Axion chips in its AI systems. Meanwhile, the company expects cumulative sales of Arm AGI CPUs to reach approximately $2 billion during FY2027 and FY2028.
For the upcoming fiscal quarter, ARM expects revenue to be approximately $1.54 billion, plus or minus $50 million, slightly higher than market forecasts of around $1.53 billion; adjusted earnings per share are projected to be $0.56, plus or minus $0.04, compared with market expectations of about $0.55.
ARM Stock Price Technical Analysis
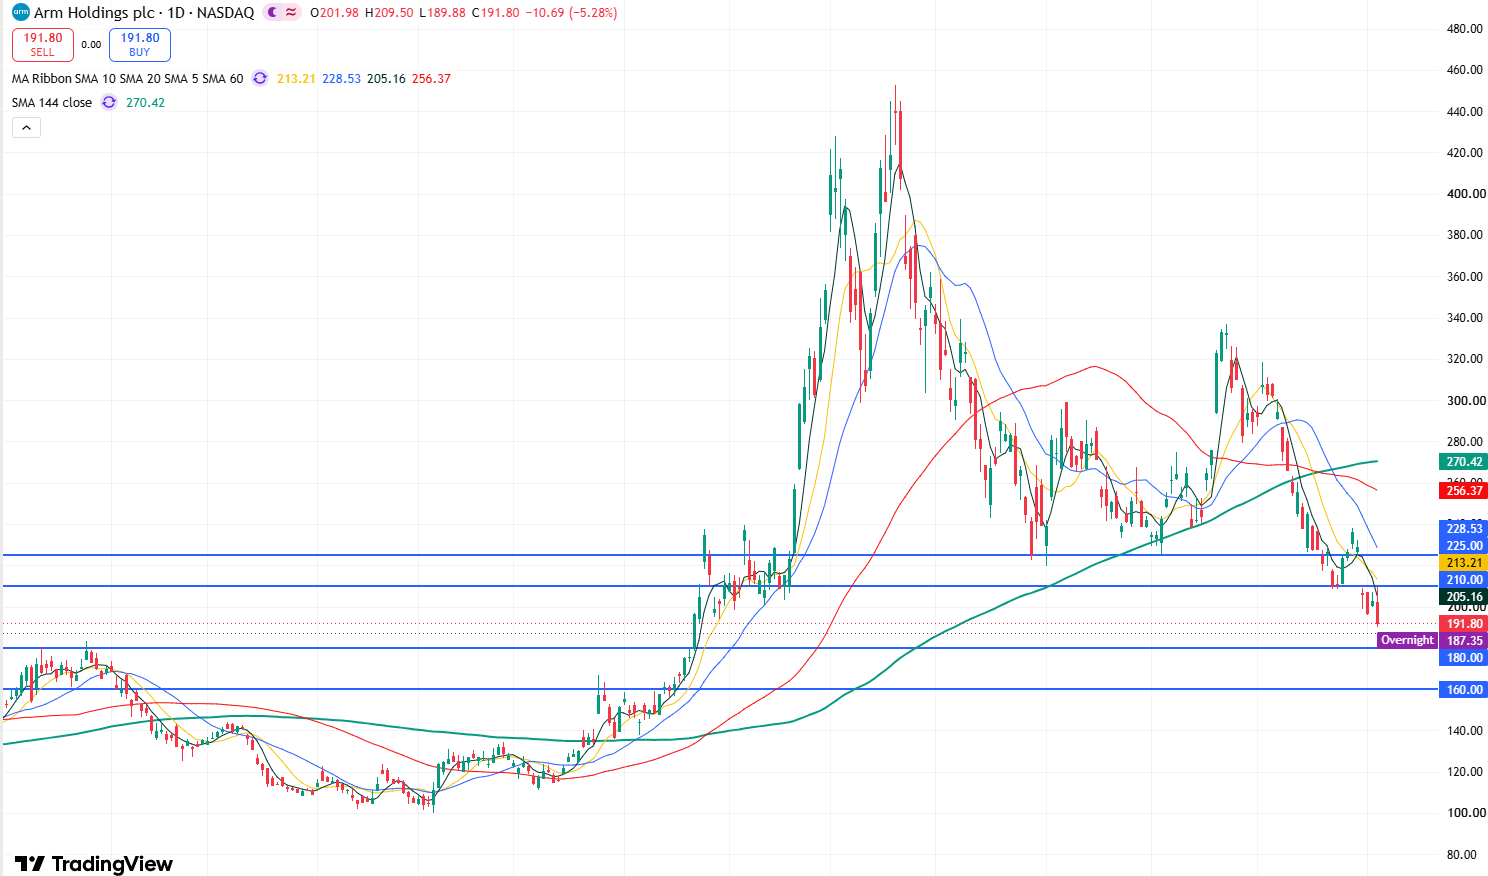
Arm stock daily chart, Source: TradingView
Looking at the daily chart of Arm's stock price, the overall trend displays a clear pattern of lower highs and lower lows, indicating a short- to medium-term downside bias. Meanwhile, as the candlestick broke below the 144-day moving average and the $225 support level, short-term bearish momentum was significantly strengthened, pushing the stock further down. Following the earnings report, the stock hit a new low in after-hours trading on Wednesday, briefly dropping below the April 29 low of $193.91.
Regarding technical indicators, the Relative Strength Index (RSI) stands around 32.7, near oversold territory, while the MACD remains in negative territory, indicating that the stock may still face further downside in the short term.
Currently, if the stock price at today's open extends the trend from the previous session's after-hours trading and breaks below $193.91, it will open up deeper downside room, with the primary downside target testing the key support level at $180. If this support fails to hold, the stock may retreat toward the support level around $160.
On the upside, if the stock stops falling and stabilizes near the $180 support level, it will see a short-term technical recovery rebound. The primary overhead resistance to watch is the $190-$200 range. If the stock establishes a footing above $200, it will continue to test the resistance zone of $210-$225. If it effectively breaks out and holds above $225, it will open up upside room toward $280.
Recommended Articles


