


Brent at $103.60: the peace trade is selling paper, but the physical market just drew 5.3 million barrels


Mitrade Insights — Brent's front-month contract settled at $103.60 on Tuesday, down 1.12%, its lowest close since October 7 and roughly 8% lower for the week. WTI settled at $96.09. The driver is diplomacy: Iran has signaled openness to peace talks, Qatar is mediating, and separate talks are scheduled for Abu Dhabi on November 10-11. The paper market is selling the war premium. The physical market, however, did not get the memo: the API reported a 5.267 million barrel draw in US crude stocks, versus a 2.1 million barrel build expected. That is the tension in one line — price is trading the talks, inventories are trading the barrel.
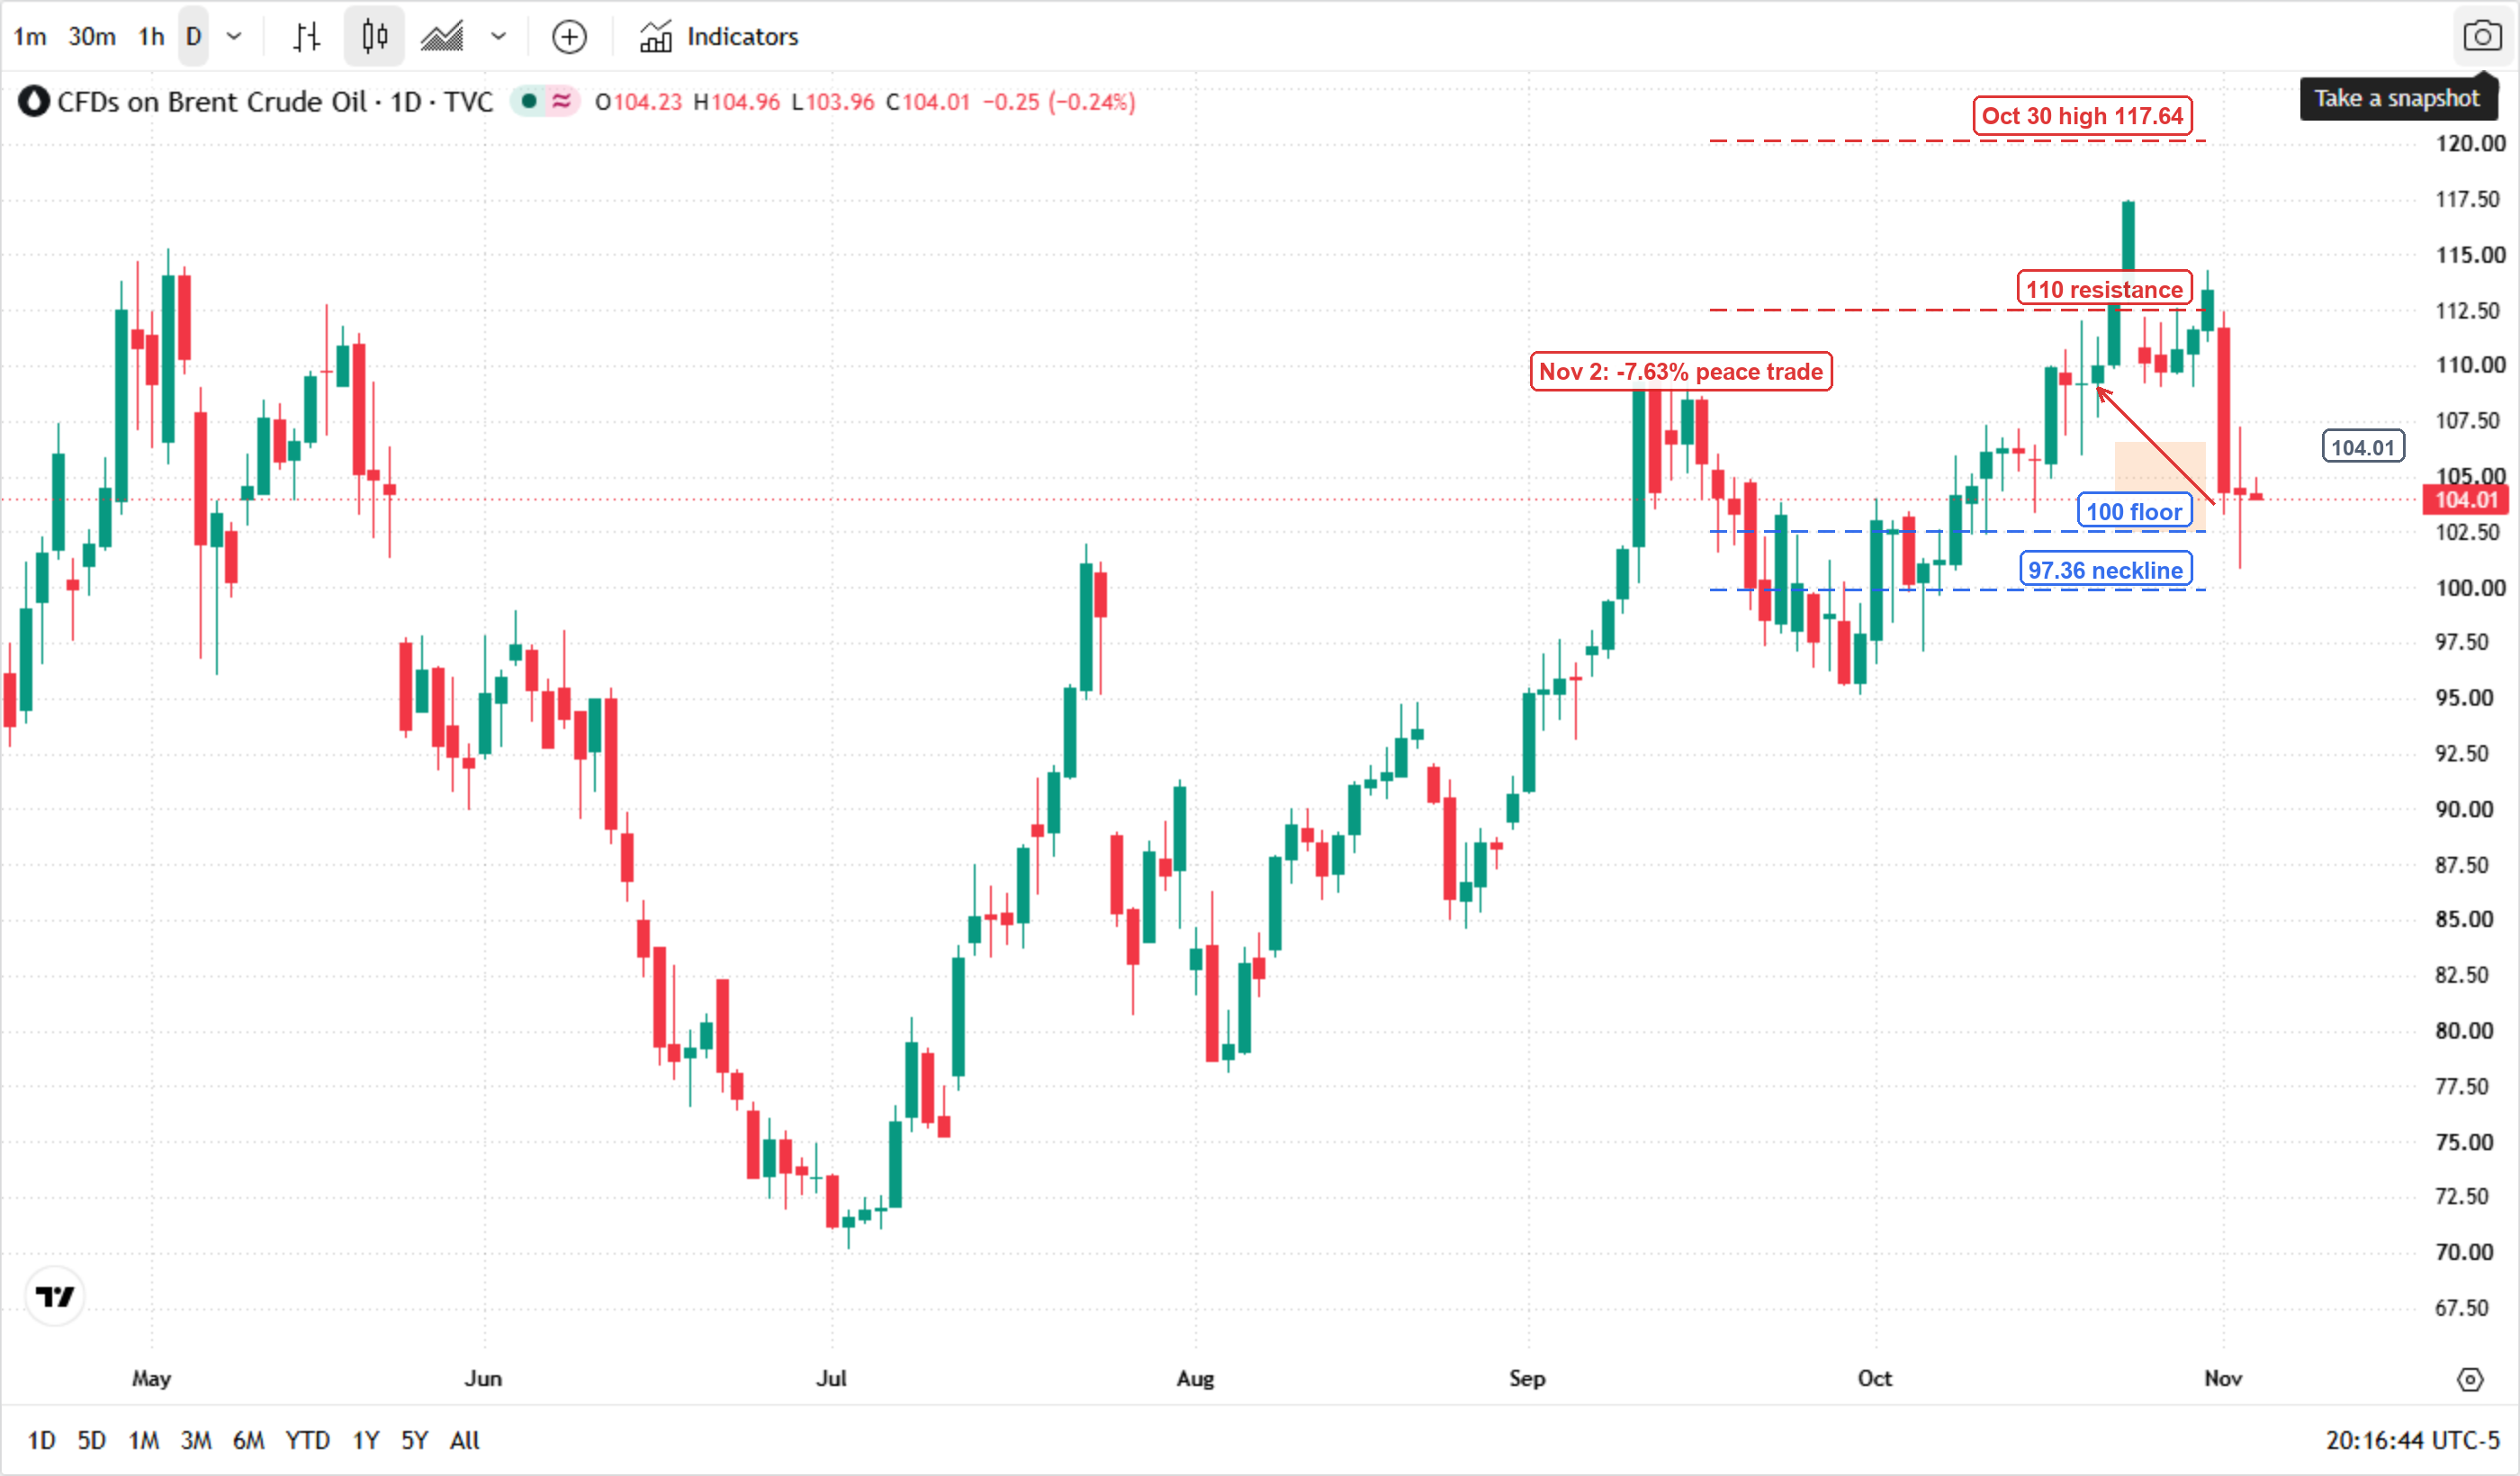
* Chart source: TradingView (TVC:UKOIL daily), 2026-11-04.
The chart shows the round trip: Brent peaked at 117.64 on October 30, then sold off to 103.60 in two sessions. The 100 floor and the 97.36 September neckline are the levels that separate a pause from a full peace-trade unwind.
From $117.64 to $103.60: what the peace trade is selling
The move started with a headline, not a barrel. Two days ago, the market was selling the Hormuz plan at $111; today it is selling the follow-through at $103.60, even as the physical data has not followed. On Monday, Iran signaled it would pursue talks; Qatar, the mediator, said both sides were reviewing new proposals. Brent fell 7.63% that session, its biggest one-day drop since July. Tuesday added another 1.12% as the market waited for details.
Qatar's mediation and the 48-hour headlines
The details are less clean than the headline. Iranian officials said Washington's response remained "unsatisfactory," and a senior official told Reuters the two sides were still "far" from a deal. Shipping disruptions continue around the Strait of Hormuz, where an effective blockade has affected roughly 20% of global oil supply. The market is not pricing peace; it is pricing a lower probability of escalation.
That distinction matters for the next move. A peace deal would remove the remaining war premium — roughly $18.8 per barrel, or the gap between $103.60 and the $86 "no-war" level used by several sell-side models. A stalled talks process would put that premium back. Neither outcome is decided yet.
5.267 million barrels: the physical market didn't get the memo
The API data is the counterweight. Crude inventories fell 5.267 million barrels in the week ended October 30, against a forecast for a 2.1 million barrel build and the prior week's 2.031 million draw. It was the fifth consecutive weekly decline. Gasoline stocks rose 1.427 million barrels; distillates fell about 1.19 million; Cushing rose 511,000; the Strategic Petroleum Reserve fell 400,000 barrels to 282.2 million.
OPEC+ is not adding barrels
OPEC+ left its December output target unchanged. That matters because the selloff is not supply-driven: if producers were adding barrels, lower prices would be a fundamentals story. Instead, the cartel is holding output steady while the paper market sells the risk premium. The Brent-WTI spread is $7.51, a reminder that the physical location premium has not collapsed.
| Paper vs physical | Latest | Signal |
|---|---|---|
| Brent front-month | $103.60 | -8% on the week |
| WTI front-month | $96.09 | -0.38% on the day |
| Brent-WTI spread | $7.51 | Location premium intact |
| API crude stocks | -5.267M | Fifth straight draw |
| Consensus for EIA | -0.2M | Small draw expected |
| OPEC+ December output | Unchanged | No new supply |
| Hormuz disruption | ~20% of global supply | Physical risk persists |
The table is the argument: the paper market is selling diplomacy, while the physical indicators are still tight.
The strongest evidence against this read is that the market may be right about the direction of travel. If a deal lands, the war premium can compress toward $86, and the API draw will not matter. The physical tightness is a snapshot; the talks are a process. That is why the next 48 hours matter more than the last two sessions.
100 and 97.36: where the paper market finds the physical floor
Brent's chart has two clear lines below the market. The first is 100, the psychological floor that held in late October. The second is 97.36, the September 22 neckline of the double top formation and the low end of the recent range. A close below 97.36 would confirm the peace trade and open the $84.53 measured target; a hold above 100 would keep the physical story alive.
What would prove the peace trade wrong
The peace trade needs two things: a deal that is credible enough to remove the war premium, and a physical market that loosens enough to justify lower prices. So far it has the first headline and not the second data point. Tonight's EIA report at 10:30 a.m. ET is the first real test: a draw of more than 2 million barrels would confirm the API signal; a build would undercut it.
| Trigger | Direction | Target |
|---|---|---|
| EIA draw > 2M barrels + Hormuz incident | Up | 110, then 117.64 |
| EIA build + credible peace framework | Down | 100, then 97.36 |
| EIA in line, talks stall | Range | 100 ~ 107 |
What would prove this read wrong. The call here is "the physical floor is real until 97.36 breaks." Two falsifiers: Brent closes below 97.36 for two sessions while the EIA confirms a build; or a credible peace framework lands and the war premium compresses toward $86 even as inventories draw. Either one would mean the paper market was right and the physical market was lagging, not leading.
Read more
* The content presented above, whether from a third party or not, is considered as general advice only. This article should not be construed as containing investment advice, investment recommendations, an offer of or solicitation for any transactions in financial instruments.


