


Interactive Brokers Group vs. Morningstar: Which Financial Stock Is a Better Buy for 2027?
Key Points
Interactive Brokers Group maintains a highly automated, low-cost trading platform serving 4.4 million global accounts.
Morningstar provides essential investment data and research with a robust 15.3% net margin.
Which of these financial services leaders is the better addition to your portfolio for 2027?
- Motley Fool Issues Rare "Total Conviction" Buy Alert ›
Choosing between a high-speed trading engine and an essential data provider requires balancing growth against steady research fees. Will Interactive Brokers Group (NASDAQ:IBKR) or Morningstar (NASDAQ:MORN) serve your portfolio better through 2027?
Interactive Brokers specializes in providing low-cost, automated trade execution for sophisticated traders around the world. Morningstar offers indispensable data and research to investors and advisors. Each represents a different segment of the capital markets, yet they both benefit from the long-term trend of increasing global participation in investing.
The case for Interactive Brokers Group
Interactive Brokers Group operates as an automated global electronic broker, providing direct-access trade execution and clearing services. It serves approximately 4.4 million institutional and individual customers, including hedge funds, registered investment advisors, and proprietary trading groups. This broad reach across more than 200 countries allows it to capture diverse activity among investors.
In fiscal 2025, revenue reached nearly $10.2 billion, representing growth of approximately 9.8% over the prior year. The company reported net income of roughly $984 million. This resulted in a net margin of nearly 9.6%, which reflects the portion of total revenue kept as profit after all business costs are paid.
As of Interactive Brokers' December 2025 balance sheet, the debt-to-equity ratio is 0, showing the company carries no total debt relative to its shareholder equity. The current ratio, which measures the ability to cover short-term obligations with current assets, is approximately 1.1. Free cash flow, calculated as cash from operations minus capital expenditures, was nearly $15.7 billion in fiscal 2025.
The case for Morningstar
Morningstar provides investors with data, research, analytics, and investment products through platforms like Morningstar Direct and PitchBook. The company serves a wide array of clients including wealth managers, asset managers, and retirement plan providers. By positioning itself as a primary source of independent research, it creates a recurring need for its tools among both professional and retail market participants.
In fiscal 2025, revenue reached $2.4 billion, reflecting growth of roughly 7.5%. The company generated net income of approximately $374.2 million for the year. This performance yielded a net margin of nearly 15.3%, indicating the company is effective at converting its sales into actual profit for shareholders.
As of its December 2025 balance sheet, Morningstar carries a debt-to-equity ratio of roughly 1.2. This ratio measures total debt against shareholder equity, suggesting the company uses a moderate amount of leverage to fund its operations. The current ratio is approximately 1, and the company generated free cash flow of nearly $442.6 million during fiscal 2025.
Risk profile comparison
Interactive Brokers Group faces significant risks related to cybersecurity threats and data privacy compliance because its operations are heavily reliant on proprietary technology. The company must also navigate complex regulatory landscapes across 40 different countries, including evolving rules for Bitcoin (CRYPTO:BTC) offerings. Furthermore, a high concentration of control held by founder Thomas Peterffy could influence corporate decisions differently than a traditional board would, while competitors like CME Group (NASDAQ:CME) continue to vie for market share.
Morningstar deals with risks involving potential reputational damage if its dual role as a researcher and investment manager is perceived as a conflict of interest. The company is also exposed to liabilities from errors in its credit ratings or research tools, which are used by massive institutional players such as BlackRock (NYSE:BLK). Additionally, its PitchBook segment is sensitive to cyclical trends in private capital markets, and it faces stiff competition from other data giants like S&P Global (NYSE:SPGI) and MSCI (NYSE:MSCI).
Valuation comparison
Morningstar appears more affordable based on its lower earnings multiple, while Interactive Brokers Group trades at a higher premium relative to its sales and future earnings estimates.
| Metric | Interactive Brokers Group | Morningstar |
|---|---|---|
| Forward P/E | 28.4 | 17.6 |
| P/S ratio | 11.7 | 3.2 |
Valuation metrics include sourcing from Financial Modeling Prep (FMP) and may differ from other data providers.
Which stock would I buy for 2027?
Both of these companies are grouped in the "financials" category, but they do (mostly) different things. Interactive Brokers facilitates trading, while Morningstar provides data (and some investment management products). So it's a little bit hard to compare; it's not an apples-to-apples situation.
Neither company has reported especially impressive revenue growth recently. Morningstar's net margin is better than Interactive Brokers', but the latter has a higher valuation. Why might this be?
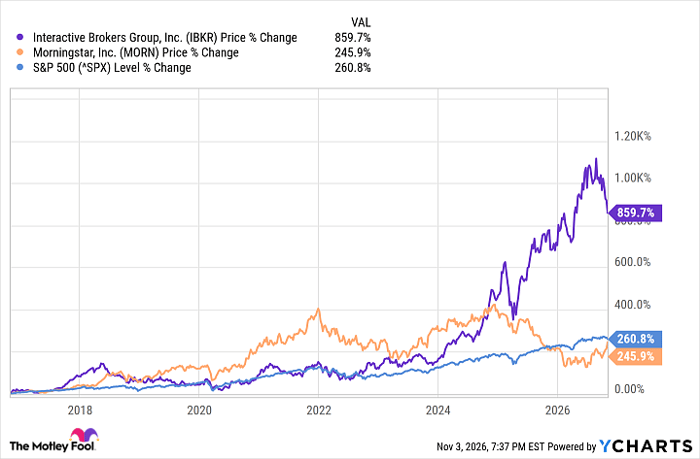
IBKR data by YCharts
Investors are clearly willing to pay a premium for Interactive Brokers, and they might be on the right track here. Morningstar shares haven't even managed to beat the S&P 500 over the past 10 years. Past performance is no indication of future results, but I find that chart pretty persuasive. I think Interactive Brokers Group is the more attractive stock here.
Should you buy stock in Interactive Brokers Group right now?
Before you buy stock in Interactive Brokers Group, consider this:
The Motley Fool Stock Advisor analyst team just identified what they believe are the 10 best stocks for investors to buy now… and Interactive Brokers Group wasn’t one of them. The 10 stocks that made the cut could produce monster returns in the coming years.
Consider when Netflix made this list on December 17, 2004... if you invested $1,000 at the time of our recommendation, you’d have $336,195!* Or when Nvidia made this list on April 15, 2005... if you invested $1,000 at the time of our recommendation, you’d have $1,241,567!*
Now, it’s worth noting Stock Advisor’s total average return is 875% — a market-crushing outperformance compared to 208% for the S&P 500. Don't miss the latest top 10 list, available with Stock Advisor, and join an investing community built by individual investors for individual investors.
See the 10 stocks »
*Stock Advisor returns as of November 4, 2026.
Erin Kennedy has positions in CME Group. The Motley Fool has positions in and recommends Bitcoin, BlackRock, CME Group, Interactive Brokers Group, MSCI, and S&P Global. The Motley Fool recommends the following options: long January 2027 $43.75 calls on Interactive Brokers Group and short January 2027 $46.25 calls on Interactive Brokers Group. The Motley Fool has a disclosure policy.
Recommended Articles


