


The Market Is Triggering a Warning Not Seen in Decades. Here's What History Says Comes Next.
Key Points
The broad market S&P 500 index has doubled over the past four years.
It's now at its second-highest valuation ever, according to the CAPE ratio.
The broad market index has gained a remarkable 771% since 2003.
- 10 stocks we like better than S&P 500 Index ›
The market has posted one of its best-ever stretches over the past four years. After falling nearly 20% in 2022, the S&P 500 (SNPINDEX: ^GSPC) has doubled. That's the power of investing and the magic of compounding.
But the market isn't a one-way ticket to riches. It goes up and down, and that can challenge hopeful investors. As the S&P 500 has expanded, so has its valuation. And as investing legend Warren Buffett has pointed out, "stocks can't outperform businesses indefinitely."
Missed AI’s "Act 1"? Act 2 Could Be 15x Bigger. Most investors think they missed the AI boat because they didn't buy Nvidia in 2005. But according to our analysts, we’re only at the end of "Act 1"—the R&D phase. "Act 2" is the global rollout. Continue »
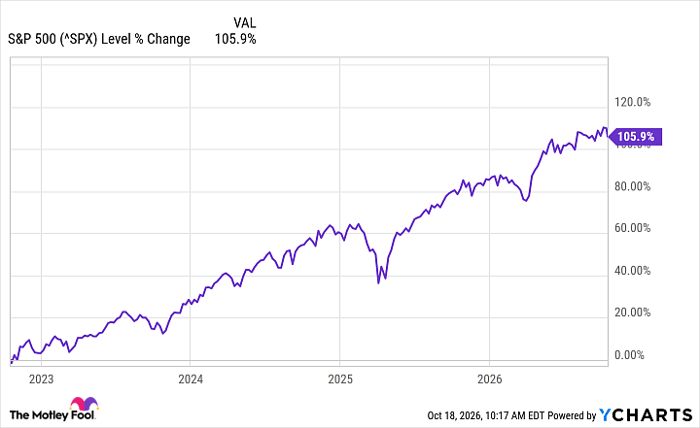
^SPX data by YCharts
The CAPE ratio, or cyclical-adjusted P/E ratio, measures the average S&P 500 P/E ratio adjusted for inflation over time. This is the number that tells investors how expensive stocks are relative to their businesses, and it's been back-calculated going back to 1879. Since then, the average has been 17.8, and there have been only two times that it's crossed 40. It first crossed that threshold in January 1999, and it continued to rise until reaching a record of 44 in January 2000. The second time it surpassed 40 was in May of this year.
However, the market is still thriving; the S&P 500 is up 12%, and the Nasdaq-100 is up 16% so far this year.
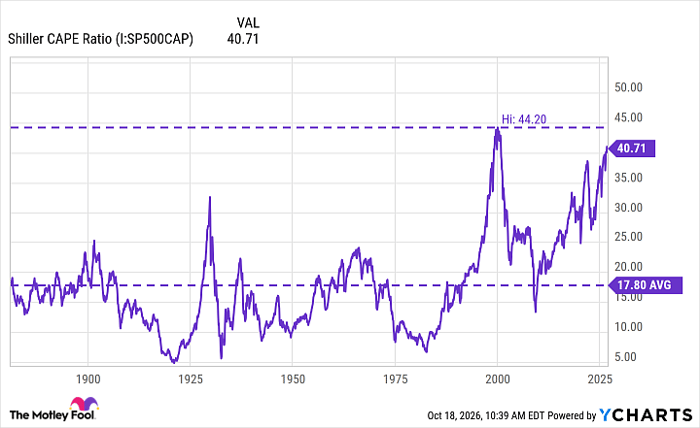
Shiller CAPE Ratio data by YCharts
Here's what happened last time and what investors can do to prepare for what history suggests might happen next.
Bull markets can't last forever
In 1999, investors had a whole year to consider whether to diversify out of the hot tech stocks that were fueling a strong bull run. But the S&P 500 gained 20% in 1999 as the dot-com era reached a peak,and many investors weren't prepared when the market plunged. That was followed by a three-year period when the S&P 500 lost more than 40% of its value, and the Nasdaq-100 lost almost three-quarters.

Image source: Getty Images.
Even if the CAPE ratio wasn't near its highest level ever, investors must keep in mind that bull markets can't last forever. Whether it happens this year or sometime further out, a crash is coming, and investors should own resilient stocks that can withstand volatility.
However, bear markets have historically been much shorter than bull markets, which is why, no matter what happens, you should be prepared to stick it out and not panic sell.
For example, since the market bottomed out and started climbing in 2003 , the S&P 500 has gained 771%. That includes a major crash in 2008, when the market lost more than 57% of its value, and the COVID-19 crash, when it dropped 34%. If you'd stayed in the market, you'd be a lot richer today. And if there's a market crash on the way, stay invested, and you're likely to be well rewarded.
Should you buy stock in S&P 500 Index right now?
Before you buy stock in S&P 500 Index, consider this:
The Motley Fool Stock Advisor analyst team just identified what they believe are the 10 best stocks for investors to buy now… and S&P 500 Index wasn’t one of them. The 10 stocks that made the cut could produce monster returns in the coming years.
Consider when Netflix made this list on December 17, 2004... if you invested $1,000 at the time of our recommendation, you’d have $370,440!* Or when Nvidia made this list on April 15, 2005... if you invested $1,000 at the time of our recommendation, you’d have $1,330,110!*
Now, it’s worth noting Stock Advisor’s total average return is 924% — a market-crushing outperformance compared to 212% for the S&P 500. Don't miss the latest top 10 list, available with Stock Advisor, and join an investing community built by individual investors for individual investors.
See the 10 stocks »
*Stock Advisor returns as of October 21, 2026.
Jennifer Saibil has no position in any of the stocks mentioned. The Motley Fool has no position in any of the stocks mentioned. The Motley Fool has a disclosure policy.
Recommended Articles


