


TradingKey Wall Street Weekly Report:Rising Inflation Intensifies Rate Pressure; Nasdaq Falls 4.48%, Its Biggest Weekly Decline Since June
Previous Week’s Market Review & Analysis
TradingKey - During the period from 2026-10-12 to 2026-10-18, the U.S. macroeconomic environment was dominated by persistent inflationary pressures and elevated global energy costs. Headline Consumer Price Index data for September released on October 14 showed annual inflation accelerating to 3.7%, driven by a 9.1% surge in gasoline prices, while monthly core CPI increased 0.3%. Wholesale inflation similarly printed hotter than anticipated, with the September Producer Price Index rising 1.3% month-over-month and 6.3% year-over-year. Crude oil prices remained elevated due to Middle East geopolitical tensions, with WTI crude settling above $101 per barrel and Brent crude briefly touching $110 per barrel. Benchmark U.S. 10-year Treasury yields experienced intraday swings near multidecade highs above 5.2% before pulling back toward 5.08% by week-end as safe-haven bond buying emerged during equity weakness.
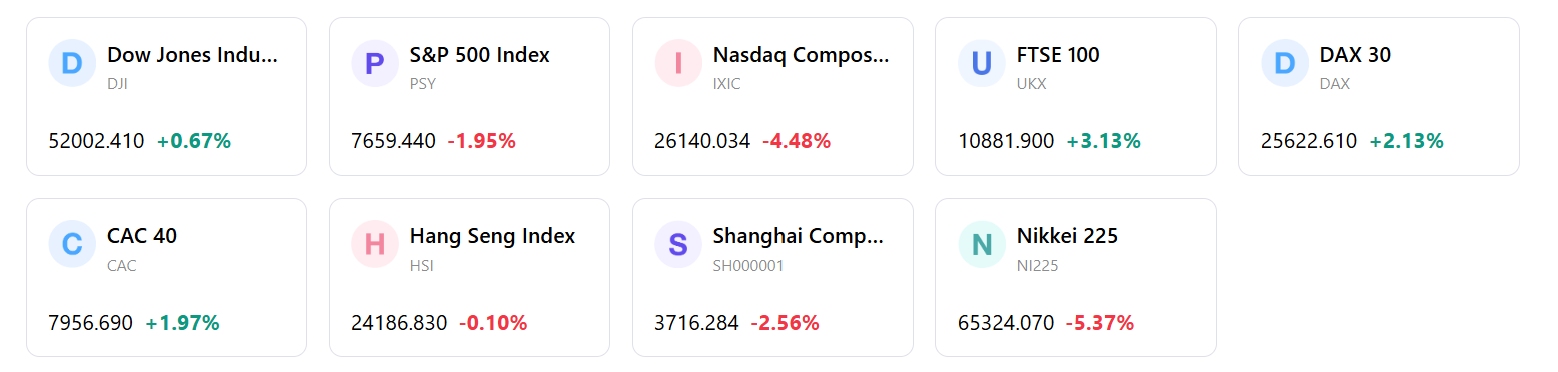
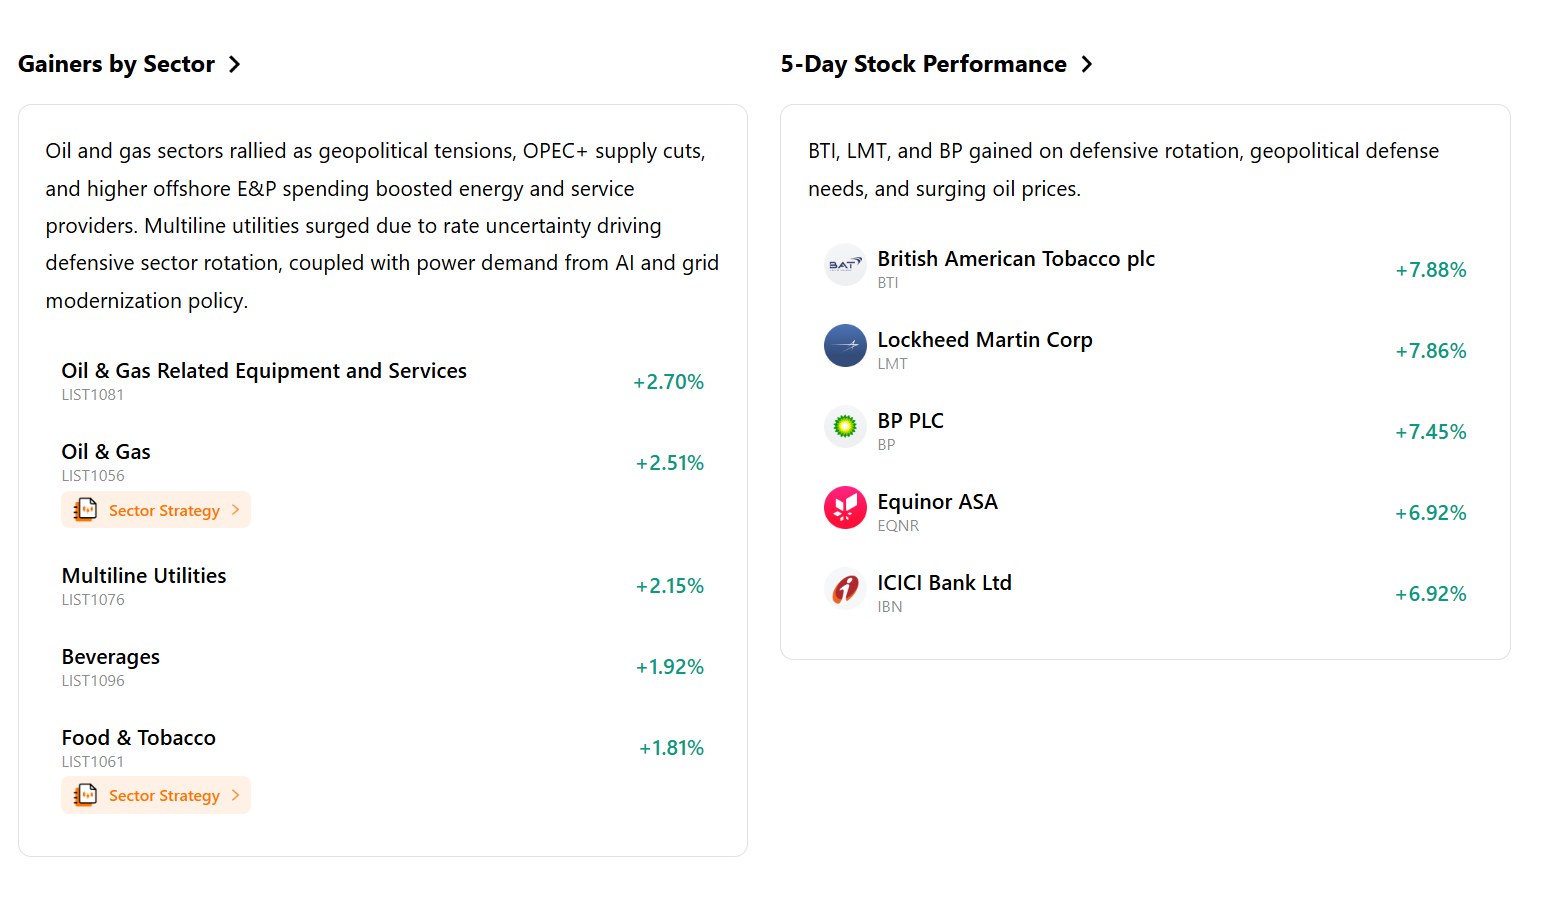
Major U.S. equity indexes displayed sharp divergence during the reporting period from 2026-10-12 to 2026-10-18. The tech-heavy Nasdaq Composite recorded its worst weekly performance since June, sinking 4.48% to end at 26,140.03, while the broad-market S&P 500 fell 1.95% to close at 7,659.44. Conversely, the Dow Jones Industrial Average rose 0.67% to settle at 52,002.41, supported by rotation into traditional blue-chip and defensive value stocks. The small-cap Russell 2000 index dropped 3.00% to finish at 2,721.37. Sector performance highlighted a severe retreat in technology and semiconductor equities, with the PHLX Semiconductor Index falling 11.41% over eight consecutive declining sessions. Meanwhile, defensive sectors including consumer staples, healthcare, utilities, and energy outperformed the broader market.
Third-quarter corporate earnings season officially kicked off with major financial institutions, including JPMorgan Chase, Goldman Sachs, Citigroup, and Wells Fargo, delivering solid top- and bottom-line figures driven by robust trading desks and net interest income. However, market attention quickly shifted to the technology sector as growing scrutiny over artificial intelligence infrastructure debt and capital expenditure returns triggered widespread selling in high-leverage neocloud and semiconductor names. Specialized AI infrastructure firms suffered steep losses, casting a shadow over chipmaker suppliers. Additionally, Fed communications and economic releases heightened concerns that persistent cost-of-living and energy pressures would compel monetary policymakers to maintain elevated interest rates through year-end.
Capital flows reflected a distinct risk-off posture within growth equities and an appetite for defensive instruments. Institutional investors moved capital away from high-beta technology shares into U.S. Treasury securities and dividend-yielding sectors. Market volatility rose markedly, with Wall Street's benchmark volatility index, the VIX, surging over 20% to settle around 20.0, indicating heightened investor anxiety. Sentiment indicators shifted sharply into pessimistic territory, as the CNN Fear & Greed Index declined to 18 out of 100, entering the extreme fear zone amid the broad pullback in mega-cap growth names and elevated bond yields.
The trading week marked a pivotal structural rotation within the U.S. bull market, driven by the dual catalysts of stubborn inflation data and a re-valuation of debt-financed technology expansion. The market logic transitioned from a broad momentum rally to a rigorous micro-fundamental assessment and defensive allocation strategy. While underlying domestic consumer spending remained resilient, persistent yield pressures and sector-specific leverage concerns have tempered broad index upside, establishing a macro environment defined by heightened cross-asset dispersion and factor rotation.
Next Week's Key Market Drivers & Investment
Looking ahead to the upcoming trading week, the market focus will center on high-profile third-quarter earnings announcements from major technology and growth leaders including Meta Platforms, Tesla, and Netflix, alongside key industrial and defense corporations. Economic releases will feature flash Manufacturing and Services PMI data, housing market indicators, and weekly initial jobless claims. Investors will also scrutinize scheduled Federal Reserve speaker comments prior to the blackout period preceding the late-October Federal Open Market Committee meeting.
Market dynamics are expected to be governed by the interplay between corporate earnings delivery and interest rate expectations. If mega-cap technology earnings demonstrate durable revenue translation and disciplined balance sheet management, tech valuations may stabilize following the recent pullback. However, persistent energy inflation and sticky wholesale price pressures are likely to keep Treasury yields elevated, sustaining institutional preference for value, high free-cash-flow yield, and defensive equity factors over speculative growth.
Portfolio strategy should prioritize risk management, quality, and cash-flow visibility. Equity allocations should maintain overweight positions in defensive value sectors, including consumer staples, healthcare, and energy producers benefiting from firm commodity prices, alongside select high-quality financial institutions with strong net interest margins. Exposure to technology and growth equities should be concentrated in high-conviction megacaps boasting fortress balance sheets and organic cash flows, while maintaining hedges and adequate cash liquidity to manage ongoing volatility.
Key risks requiring close oversight include a potential second wave of inflation driven by sustained crude oil prices above $100 per barrel, which could force the Federal Reserve into a more aggressive rate path. Furthermore, credit market stress surrounding heavily leveraged artificial intelligence infrastructure providers poses risk of broader market contagion. Geopolitical volatility in energy-transit regions and potential revenue guidance downgrades during the peak of earnings season also present downside risks to broader market stability.
Markets Weekly
5-Day Index Performance
Recommended Articles


