


The Stock Market Hasn't Been This Expensive in Decades. Should Investors Prepare for a Crash?
Key Points
The Shiller P/E ratio is at its highest level since the dot-com bubble era.
Stock market crashes have always been a part of the stock market cycle, and that will continue.
Trying to time the market can cause you to miss out on some of the market's best days and limit your gains.
- 10 stocks we like better than S&P 500 Index ›
Based on the S&P 500 (SNPINDEX: ^GSPC), the market has been on a roll since the bear market in 2022. Since it hit its trough on Oct. 12, 2022, the index is up over 91%. These gains have been rewarding, but they've also made the market expensive, which has worried some investors.
The Shiller P/E ratio is one way to gauge how expensive the market is. It looks at the average inflation-adjusted earnings of S&P 500 companies over the past 10 years. Zooming out a decade and adjusting for inflation removes one-off years and provides perspective on long-term valuation trends.
Missed AI’s "Act 1"? Act 2 Could Be 15x Bigger. Most investors think they missed the AI boat because they didn't buy Nvidia in 2005. But according to our analysts, we’re only at the end of "Act 1"—the R&D phase. "Act 2" is the global rollout. Continue »
As of the beginning of October, the Shiller P/E ratio was 40.7, the highest it has been since the dot-com bubble. During that time, the Shiller P/E ratio stayed above that mark from most of 1999 through mid-2000. Unfortunately, we know how the dot-com bubble ended: The S&P 500 fell around 49% between March and October 2022.
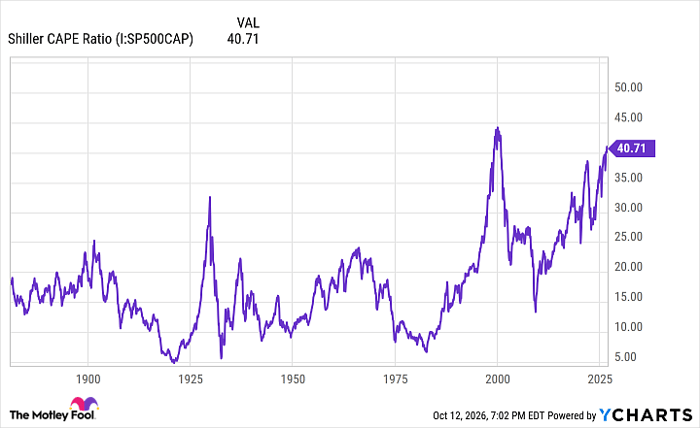
Shiller CAPE Ratio data by YCharts
Given how expensive the current market is and how it historically compares to one of the most significant crashes in stock market history, should investors start preparing for a repeat? While it's always better to be overprepared than underprepared, that's the wrong mindset.
More of a feature than bug
When it comes to stock market crashes, the first thing investors need to realize is that they're inevitable. The length and severity vary widely, but they have always happened, and they'll keep happening. Whether it's short and sharp like the COVID-19 crash, which lasted 33 days and saw the market drop around 34%, or drawn out like the dot-com crash, which lasted around 929 days, a crash is a natural part of the stock market cycle.
While it might sound backward, a market crash isn't always the worst thing for long-term investors. On one hand, it can be a clearance sale, putting you in a position to scoop up shares at a lower price than before. On the other hand, if the market never dropped, valuations would be really unsustainable, and long-term upside would be severely limited.
Granted, this isn't quite the case for people nearing or in retirement who may need to cash out shares soon. But that highlights the importance of proper allocation and a cash cushion to lean on. You don't want to be forced to sell shares while they're down.
Don't play a gambling game
The main issue with trying to anticipate a market crash is that it amounts to trying to time the market. And in this case, it could keep you from investing. After all, why invest now if you expect a crash soon? Lots of people wouldn't buy a $100 pair of shoes today if they knew they could buy them for $80 next week.
The problem is that trying to time the market is a game of chance that most investors end up on the losing side of. Nobody can predict how the market will move in the short term. That goes for both the average investor and billion-dollar Wall Street firms. If it were that easy, investors would never lose money or always be on top of the next big opportunity.
Time in the market matters more than timing the market correctly because it helps you capture the market's best-performing days. Waiting to invest because you expect a crash while the market keeps climbing could mean missing out on valuable gains.
From 1995 to the end of 2025, missing just 10 of the market's best days meant averaging 7.4% annual returns, versus 10.3%. That might seem small, but it's the difference between a $10,000 investment growing to $192,168 versus $85,491.
There's no way to know when a stock market crash will happen, so stressing over it or trying to time it can be more harmful than helpful. The best thing to do is remain consistent and trust that, even when a market crash happens, it will bounce back over time (it always has). Don't miss the best days trying to avoid the worst days.
Should you buy stock in S&P 500 Index right now?
Before you buy stock in S&P 500 Index, consider this:
The Motley Fool Stock Advisor analyst team just identified what they believe are the 10 best stocks for investors to buy now… and S&P 500 Index wasn’t one of them. The 10 stocks that made the cut could produce monster returns in the coming years.
Consider when Netflix made this list on December 17, 2004... if you invested $1,000 at the time of our recommendation, you’d have $380,579!* Or when Nvidia made this list on April 15, 2005... if you invested $1,000 at the time of our recommendation, you’d have $1,359,789!*
Now, it’s worth noting Stock Advisor’s total average return is 931% — a market-crushing outperformance compared to 212% for the S&P 500. Don't miss the latest top 10 list, available with Stock Advisor, and join an investing community built by individual investors for individual investors.
See the 10 stocks »
*Stock Advisor returns as of October 15, 2026.
Stefon Walters has no position in any of the stocks mentioned. The Motley Fool has no position in any of the stocks mentioned. The Motley Fool has a disclosure policy.
Recommended Articles


