


Morgan Stanley Q3 Earnings Preview: Revenue Expected to Grow 10.8%, Highest Wall Street Target Price Sees $262
TradingKey - Morgan Stanley (MS) will report its third-quarter fiscal 2026 financial results before the market open on October 14, Eastern Time, and host an earnings conference call at 9:30 a.m. on the same day.
As of press time in U.S. pre-market trading on October 13, MS stock was trading at $192.28, up 1.19%.
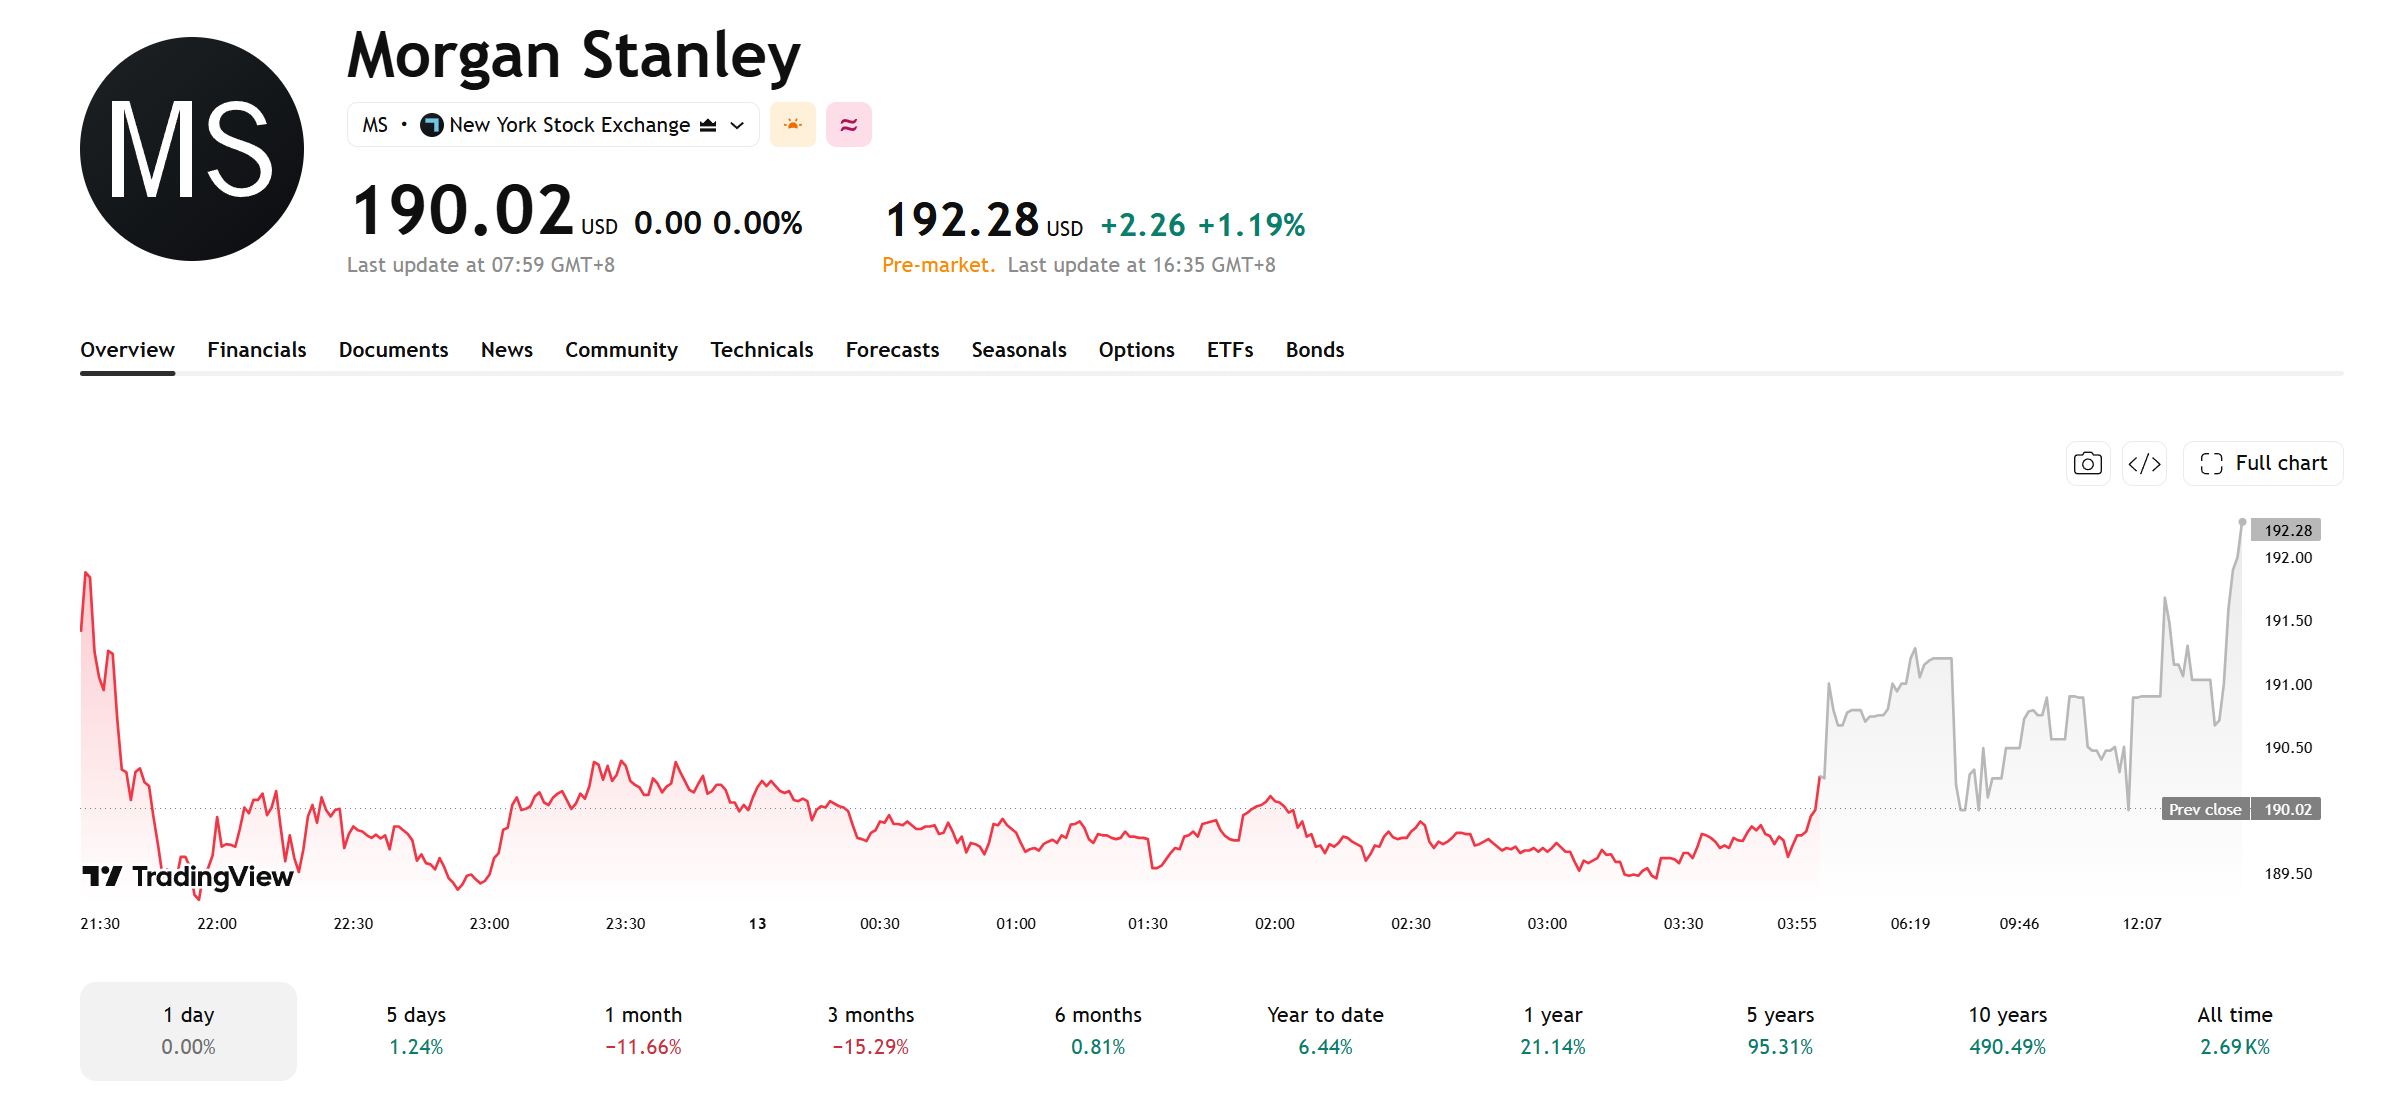
[Source: TradingView]
Market Expectations: Q3 Revenue Expected to Grow 10.8%, But Profit Expectations Decline
According to data from 16 analysts compiled by AlphaStreet, the market expects Morgan Stanley's third-quarter revenue to reach $20.19 billion and earnings per share to be $2.94.
Based on revenue of $18.224 billion in the third quarter of 2025, revenue for this quarter is expected to grow by approximately 10.8% year-over-year.
Over the past 30 days, the market consensus for EPS has been revised down from $3.16 to $2.94, indicating that some analysts have grown cautious about the growth rate of trading revenue and investment banking.
Analysts currently estimate EPS to range from $2.60 to $3.20 and revenue to range between $19.83 billion and $21.48 billion. The wide forecast range indicates growing market divergence, which could increase the risk of post-earnings stock price volatility.
Q2 Earnings Review: Trading and Investment Banking Drive Profit Growth
In the second quarter, Morgan Stanley recorded net revenues of approximately $21.35 billion, up 27% year-over-year; net income was $5.581 billion, up 58% year-over-year; and earnings per share were $3.46, up from $2.13 in the same period last year.
Institutional Securities net revenues reached $11.04 billion, up 44% year-over-year. Among these, equity business revenues were $6.3 billion, up 69% year-over-year; investment banking revenues were $2.437 billion, up 58% year-over-year; and fixed income revenues were $2.455 billion, up 13% year-over-year. Equity trading and investment banking were the primary drivers of growth for the division.
Wealth Management net revenues totaled $8.856 billion, up 14% year-over-year, driven primarily by asset management fees, net interest income, and client asset growth. The division added $148 billion in net new assets during the quarter.
Key Focus Metrics: Trading Revenue, Investment Banking Fees and Wealth Management Assets
In the third quarter, the market will focus closely on the performance of Morgan Stanley's Institutional Securities segment. According to market forecasts cited by the Financial Times, combined equities and fixed-income trading revenue across five major investment banks could reach $38 billion, up about 13% year-over-year, but down roughly 20% from record levels in the second quarter.
Therefore, the actual decline in Morgan Stanley's trading revenue, as well as its performance relative to peers, will shape market expectations for its full-year earnings.
The market currently expects Morgan Stanley's investment banking revenue within the Institutional Securities segment to reach approximately $2.16 billion in the third quarter. Investors will watch whether growth in M&A advisory, equity issuance, and debt underwriting revenue can be sustained, along with management's assessment of the deal pipeline for the fourth quarter.
For the Wealth Management segment, key areas to watch include net new assets, client asset scale, and net interest income. Revenue in this segment is typically more stable than in trading, but market pullbacks could weigh on asset management fees, while rising deposit costs may also squeeze net interest income.
Wall Street's Highest Price Target Sees $262
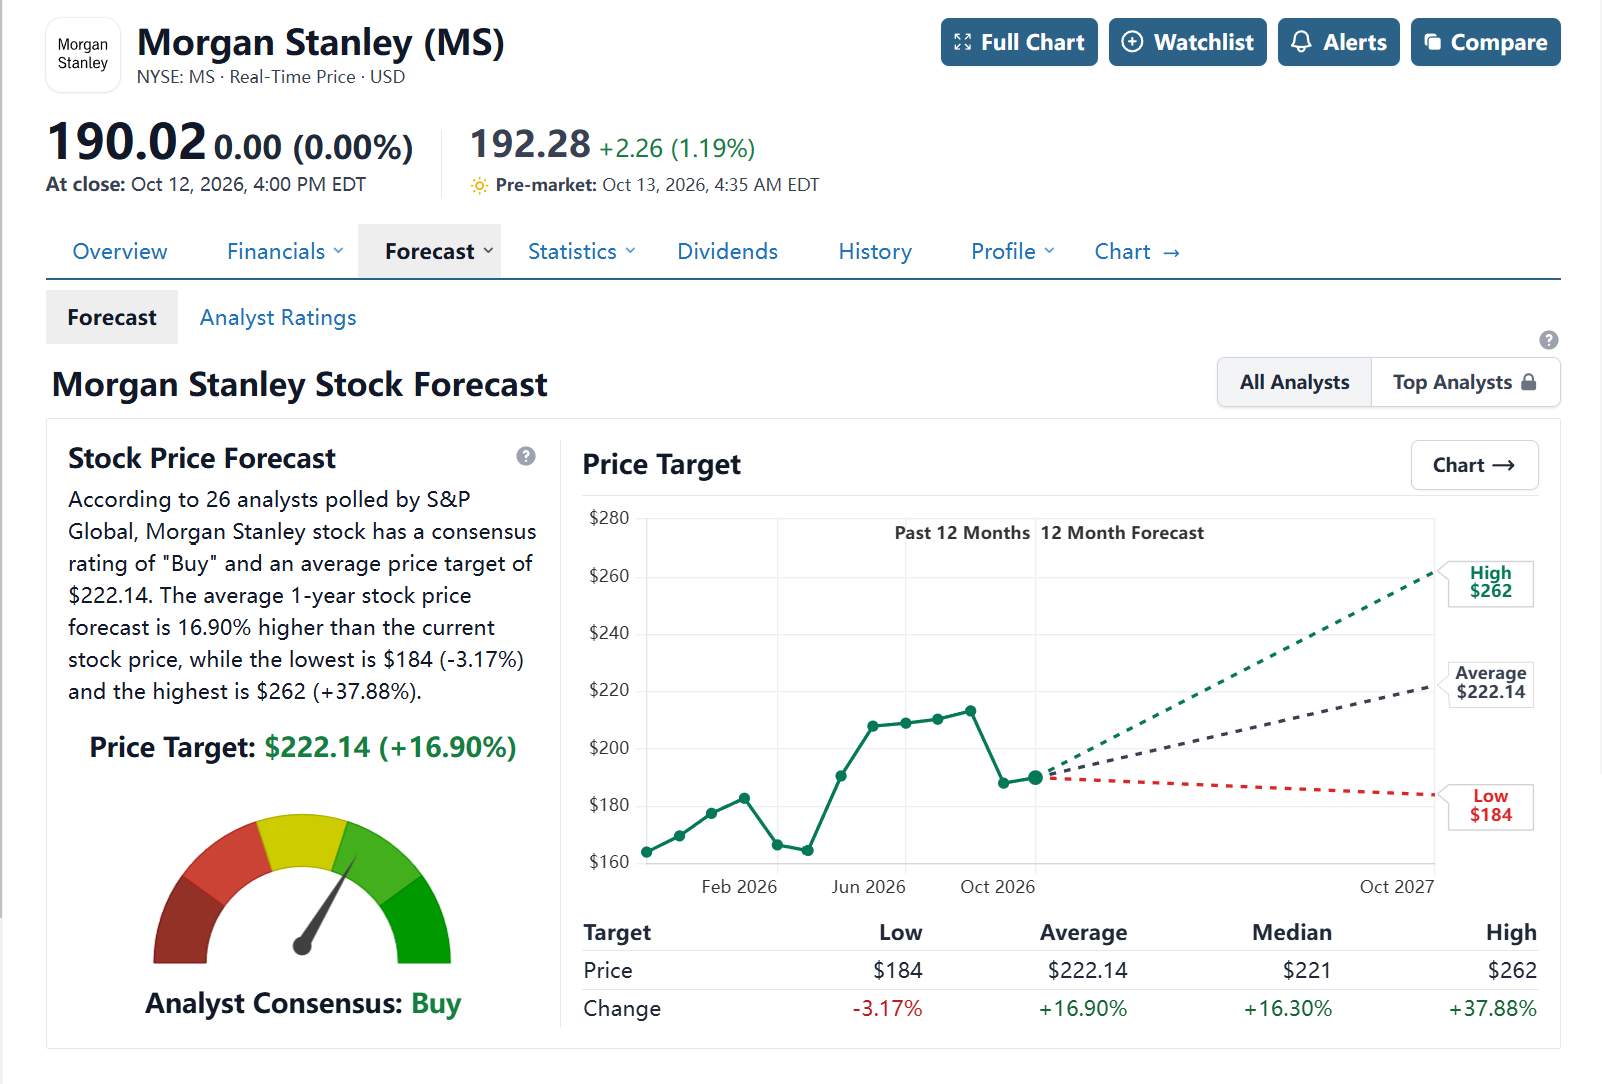
According to Stock Analysis data, 26 analysts have an average target price of $222.14 for Morgan Stanley, which is about 16.9% higher than its closing price of $190.02 on October 12, with the highest target price reaching $262.
[Source: Stock Analysis]
The market expects Morgan Stanley's third-quarter trading revenue to maintain year-over-year growth, but pull back from the record levels seen in the second quarter. Investors will also focus on investment banking revenue, net new wealth management assets, net interest income, and expense control.
If the decline in trading revenue is limited, investment banking continues to grow, wealth management assets maintain inflows, and EPS exceeds the market estimate of around $2.94, the stock price could move closer to $220. Conversely, if trading activity cools significantly, investment banking deal flow falls short of expectations, or management lowers its outlook, the stock may retest support near $180.
Currently, the primary market focus is whether wealth management can continue to provide steady growth after capital markets operations cool down.
Recommended Articles


