


Inflation. The Iran War. A Hawkish Fed. Soaring Bond Yields. And Concerns About Artificial Intelligence. The Stock Market Faces Many Hurdles, But Only 1 Metric Truly Matters Right Now
Key Points
Knowing everything that has happened, if you had asked investors before the year started how the market would fare, many likely would have taken a bearish view.
However, the market is having a solid year.
There's one factor enabling the S&P 500 to keep plowing higher, and it's the same metric investors should watch to see whether the market can continue its run.
- 10 stocks we like better than S&P 500 Index ›
Many investors are surprised that the broader benchmark S&P 500 (SNPINDEX: ^GSPC) has been so resilient this year.
After all, the market faces no shortage of concerns, whether it's the ongoing Iran war, which has led to high oil and gas prices, concerns about persistent inflation, a hawkish Federal Reserve, soaring bond yields, or broad concerns about artificial intelligence.
Missed AI’s "Act 1"? Act 2 Could Be 15x Bigger. Most investors think they missed the AI boat because they didn't buy Nvidia in 2005. But according to our analysts, we’re only at the end of "Act 1"—the R&D phase. "Act 2" is the global rollout. Continue »
Yet the S&P 500 is up nearly 12% this year (as of Sept. 19), and that's after two spectacular years in 2023 and 2024. While all the concerns mentioned above are valid and certainly influence markets, only one metric truly matters right now in determining whether the stock market will continue to move higher.

Image source: Getty Images.
S&P 500 earnings growth
The main driver of the S&P 500 has been, and will continue to be, collective earnings growth in the index.
If an index or stock maintains the same earnings multiple and continues to grow earnings, or forward earnings estimates among Wall Street analysts continue to grow, that will push the price higher.
Furthermore, investors start assigning higher multiples to a stock or index if it demonstrates sustained earnings growth. And that's exactly what has happened to the S&P 500.
In a note issued on Sept. 11, FactSet's Senior Earnings Analyst John Butters noted that S&P 500 earnings are projected to grow 28.7% in the third quarter, which ends on Sept. 30. That would mark the third consecutive quarter in which the S&P 500 has generated at least 25% annual growth.
Obviously, what drives earnings is important, and factors such as higher oil prices and interest rates could prove to be headwinds. However, artificial intelligence still appears to be a significant tailwind.
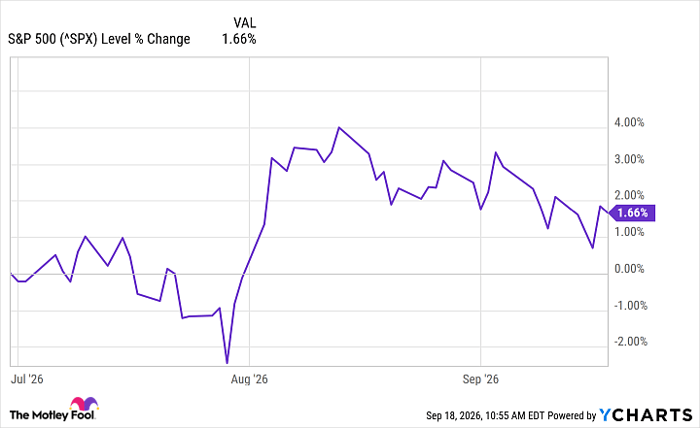
Butters noted that third-quarter earnings growth has been revised higher from 26.6% as of June 30. The S&P 500 has also pulled back since August, making the forward earnings valuation look more attractive.
^SPX data by YCharts
At the time of Butters' note, the S&P 500's forward one-year price-to-earnings ratio was 19.1 times, below its five-year average of 19.8 times.
A research note from a team of market strategists led by Truist's Keith Lerner notes that technology stocks, a major part of the index, have undergone a significant reset.
The State Street® Technology Select Sector SPDR® ETF, which holds major tech and AI stocks like Nvidia, Apple, and Microsoft, has seen its forward earnings multiple decline from 32 last October to roughly 21 now.
"There are still risks and open questions around circular financing and the pace of new model development," Lerner stated in his note. "Yet, with tech's relative valuation premium down to approximately 9%, near the lowest level of the past decade, the sector appears to be reflecting at least some of that uncertainty."
The declining S&P 500 multiple is a bullish indicator
Investors should remember that a price-to-earnings multiple has a numerator, the price of an index or stock, and a denominator, typically the one-year trailing or projected forward earnings.
If earnings decline and the price of a stock or index doesn't, it can be a bearish signal, even though the earnings multiple has just widened.
This is because it suggests that the price may not fully reflect the declining earnings power of the company or index. But if the opposite happens, in which earnings expand, and the price doesn't, it leaves upside, suggesting the market may not have caught on to the additional earnings upside.
At the same earnings multiple, that means a higher stock or index price.
Now, of course, the market has good reasons to be skeptical. The Fed is hawkish, and bond yields are high, which increases borrowing costs and could have a chilling effect on the economy. Ongoing higher oil prices will also further pressure consumers and businesses.
And then there is still broad, strong uncertainty about AI.
But if strong earnings growth continues to materialize, the S&P 500 is likely to rise further, regardless of what else is happening in the world. Investors should be watching how analysts revise forward S&P 500 earnings closely.
If they continue to raise forward estimates, the market should overcome all of the other hurdles.
Should you buy stock in S&P 500 Index right now?
Before you buy stock in S&P 500 Index, consider this:
The Motley Fool Stock Advisor analyst team just identified what they believe are the 10 best stocks for investors to buy now… and S&P 500 Index wasn’t one of them. The 10 stocks that made the cut could produce monster returns in the coming years.
Consider when Netflix made this list on December 17, 2004... if you invested $1,000 at the time of our recommendation, you’d have $387,158!* Or when Nvidia made this list on April 15, 2005... if you invested $1,000 at the time of our recommendation, you’d have $1,365,749!*
Now, it’s worth noting Stock Advisor’s total average return is 932% — a market-crushing outperformance compared to 211% for the S&P 500. Don't miss the latest top 10 list, available with Stock Advisor, and join an investing community built by individual investors for individual investors.
See the 10 stocks »
*Stock Advisor returns as of September 21, 2026.
Bram Berkowitz has no position in any of the stocks mentioned. The Motley Fool has positions in and recommends Apple, Microsoft, Nvidia, and Truist Financial. The Motley Fool has a disclosure policy.
Recommended Articles


