


A Bear Market Is Looming: Here Is 1 Smart Move Investors Can Make That History Shows Will Pay Off
Key Points
There are several indicators that a bear market could be near.
However, no indicator is perfect, and staying invested is the smart move.
- 10 stocks we like better than S&P 500 Index ›
The one thing that is certain about the stock market is that it will have its ups and downs. While the general long-term trend for stocks has always been up, there have also always been some major bumps along the way.
That means we're eventually going to see another bear market, and there are clear indications that it could be sooner rather than later. The average bull market lasts around 2.7 years, and the current one we are in has already lasted longer than that, with it about to turn four years old in October.
Missed AI’s "Act 1"? Act 2 Could Be 15x Bigger. Most investors think they missed the AI boat because they didn't buy Nvidia in 2005. But according to our analysts, we’re only at the end of "Act 1"—the R&D phase. "Act 2" is the global rollout. Continue »
Meanwhile, factors that led to two of the last four bear markets are potentially in place. The Federal Reserve raising interest rates to fight inflation helped trigger the last bear market in 2022, and the Fed has already started to go down this path. At the same time, the bursting of the dot-com bubble shares similarities with the current AI boom. A couple of valuation metrics have also reached levels similar to those of the dot-com era.

Image source: Getty Images.
The first valuation metric that has reached dot-com era levels is the CAPE (cyclically adjusted price-to-earnings) ratio, which climbed above 40 for the first time since 2000. The metric, created by famed economist Robert Shiller, looks at the P/E of the S&P 500 (SNPINDEX: ^GSPC) over the past decade, adjusting for inflation in order to smooth out economic cycles.
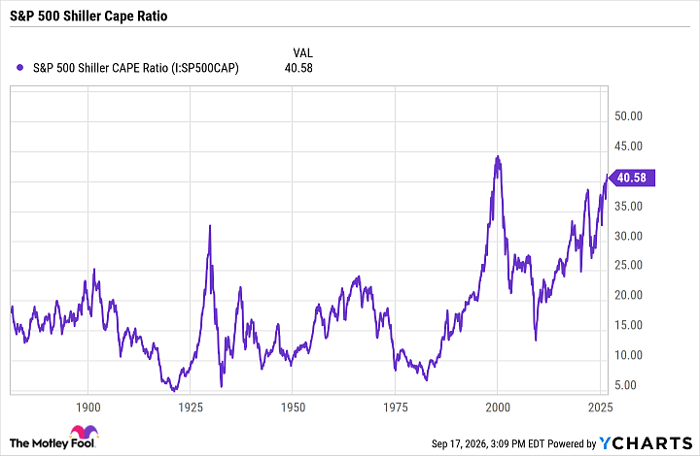
Data by YCharts.
In addition, the so-called Buffett indicator, one of Warren Buffett's favorite valuation measures, recently reached an all-time high, surpassing levels hit during the dot-com boom. The metric divides the U.S. stock market's market capitalization by GDP (gross domestic product). The ratio climbed to over 140% during the dot-com bubble, while today it's over 230%.
The 1 move investors should make
Despite a potential bear market, the one move investors should make is not to panic and to stay invested. While that sounds counterintuitive, it's actually the best thing you can do. There are a few reasons for this.
First, no one can consistently predict a bear market in advance. While the current bull market has lasted longer than average, there have been bull markets that lasted much longer. In fact, the last two big bull markets lasted about a decade.
Second, the CAPE ratio and Buffett indicator valuation metrics, often cited to argue that the market is overvalued, aren't perfect. The market today is much different from what it was 10 to 20 years ago. In the past, industrial, energy, and financial companies accounted for a much larger share of the market. Today's market is dominated by megacap tech stocks with less cyclical and economically sensitive business models that have strong balance sheets, generate a boatload of operating cash flow, and continue to see strong revenue growth. These businesses deserve higher valuations. Meanwhile, the Buffett indicator has been rising steadily over the past 15 years, reflecting market changes.
The impact of AI should also not be overlooked. Unlike the advent of the Internet, AI demand is not capped by population restraints, and the payback and return on investment for cloud providers tends to be much quicker and higher than the one that telecoms saw. This completely changes the game and is another reason why investors should stay invested.
Sitting on the sidelines, mostly in cash, is generally never a good move. One, if a pullback never comes, you're going to miss out on gains. Second, even if the market does dip, you need to time it correctly to get back in. The stock market's biggest gains often happen following market declines, and if you're frozen on the sidelines waiting for a further drop, you're likely going to miss out on some important gains. J.P. Morgan found that if an investor missed the 10 best days in the market, their average long-term return would fall by 40%.
As such, the best move to make right now is to stay invested and be ready to buy on a dip with any cash on hand. After all, bear markets tend to be short, lasting less than a year on average, and the S&P 500 has always risen over the long term.
Should you buy stock in S&P 500 Index right now?
Before you buy stock in S&P 500 Index, consider this:
The Motley Fool Stock Advisor analyst team just identified what they believe are the 10 best stocks for investors to buy now… and S&P 500 Index wasn’t one of them. The 10 stocks that made the cut could produce monster returns in the coming years.
Consider when Netflix made this list on December 17, 2004... if you invested $1,000 at the time of our recommendation, you’d have $387,158!* Or when Nvidia made this list on April 15, 2005... if you invested $1,000 at the time of our recommendation, you’d have $1,365,749!*
Now, it’s worth noting Stock Advisor’s total average return is 932% — a market-crushing outperformance compared to 211% for the S&P 500. Don't miss the latest top 10 list, available with Stock Advisor, and join an investing community built by individual investors for individual investors.
See the 10 stocks »
*Stock Advisor returns as of September 21, 2026.
JPMorgan Chase is an advertising partner of Motley Fool Money. Geoffrey Seiler has no position in any of the stocks mentioned. The Motley Fool has positions in and recommends JPMorgan Chase. The Motley Fool has a disclosure policy.
Recommended Articles


