


Is a Recession Coming in 2026? History Has Good and Bad News for Investors.
Key Points
The U.S. economy doesn't look recessionary right now -- in fact, most professional forecasters predict growth for the rest of 2026.
The S&P 500 is trading at its second-highest CAPE ratio in 156 years, making it very expensive by historical standards.
Investors should exercise caution in 2026 and pick businesses with durable earnings.
- 10 stocks we like better than S&P 500 Index ›
Anyone who is eager to know the answer to the question, "Will there be a recession this year?" is bound to feel frustrated and disappointed with the two most commonly given answers.
On the one hand, you'll hear, "Yes, a recession will likely come," which essentially means, "Recessions happen from time to time, and this bull market will wobble at some point." The other common answer, even less definite then first, leaves you more in the dark: "No one can predict what happens to the market -- your guess is as good as mine."
Missed AI’s "Act 1"? Act 2 Could Be 15x Bigger. Most investors think they missed the AI boat because they didn't buy Nvidia in 2005. But according to our analysts, we’re only at the end of "Act 1"—the R&D phase. "Act 2" is the global rollout. Continue »
Actually, both answers aren't wrong in a basic sense: Recessions happen, and nobody can predict the day they will arrive. But that doesn't mean we can't gather a general sense of where the market is heading, of whether the conditions for a recession are beginning to take shape, or if something entirely different is beginning to form. When we look at some common recession indicators, the picture today might look less ominous than investors think.
Image source: Getty Images.
The good news
The good news is simply this: The U.S. economy is growing, employers are adding jobs, and many professional forecasters are actually very optimistic about future growth.
In the second quarter of 2026, the U.S. economy grew at an annual rate of 1.5%. True, this growth was slower than in the first quarter of 2026 (2.1%), and slower compared to the second quarter of 2025 (about 3.8%). Slow growth is something to watch keenly, but positive gross domestic product growth nevertheless shows that the economy is still expanding.
Then there's the Conference Board's Leading Economic Index (LEI), a widely followed gauge that looks for signs the economy might be slowing down or speeding up. At the end of August, the LEI had good news: The index rose 0.2% in July, turning its six-month growth rate positive for the first time in more than four years. Most components in the index were positive, with consumer expectations being a notable exception. The Conference Board took this as a sign that moderate economic growth could lie ahead.
Finally, the August survey of professional forecasters from the Philadelphia Fed was also positive. According to 32 forecasters, the U.S. economy seems to be in a better place than it was three months ago, with forecasts for 2.5% annualized growth in the third quarter and 2.3% in the fourth.
None of this screams "recession" in 2026. There is, however, something looming over the market that deserves attention.
The bad news
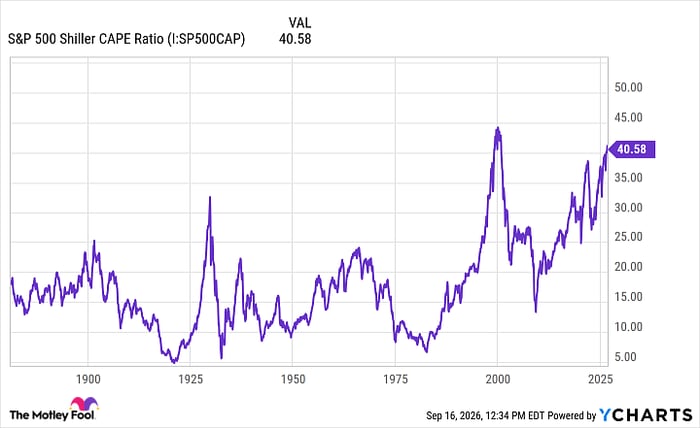
The S&P 500 (SNPINDEX: ^GSPC) has now entered extreme valuation territory not seen since the dot-com crash of 2000.
Data by YCharts.
The Shiller CAPE ratio, as shown above, has been hovering around 40 to 41. That makes this market the second most expensive in the last 156 years.
The CAPE, to be sure, doesn't predict recessions. At the same time, periods with lower returns have often followed unusually high CAPE valuations.
So, is a recession coming in 2026? The good news: Indicators suggest it is not. The economy is growing, and will likely continue growing for the rest of the year. The bad news: Stock valuations are high, and future returns could be harder to come by. Thus, now more than ever, it's important to favor strong businesses and high-quality stocks and be a little more cautious than usual.
Should you buy stock in S&P 500 Index right now?
Before you buy stock in S&P 500 Index, consider this:
The Motley Fool Stock Advisor analyst team just identified what they believe are the 10 best stocks for investors to buy now… and S&P 500 Index wasn’t one of them. The 10 stocks that made the cut could produce monster returns in the coming years.
Consider when Netflix made this list on December 17, 2004... if you invested $1,000 at the time of our recommendation, you’d have $387,158!* Or when Nvidia made this list on April 15, 2005... if you invested $1,000 at the time of our recommendation, you’d have $1,365,749!*
Now, it’s worth noting Stock Advisor’s total average return is 932% — a market-crushing outperformance compared to 211% for the S&P 500. Don't miss the latest top 10 list, available with Stock Advisor, and join an investing community built by individual investors for individual investors.
See the 10 stocks »
*Stock Advisor returns as of September 20, 2026.
Steven Porrello has no position in any of the stocks mentioned. The Motley Fool has no position in any of the stocks mentioned. The Motley Fool has a disclosure policy.
Recommended Articles


