


General Motors Stock Tests $87.65 as Truck Strength and Hybrid Risk Shape the Next Move
TradingKey - General Motors closed at $87.13 on September 17, up 3.37% from the September 16 close of $84.29 and above the $86.60 chart reference. From a technical analysis perspective, the stock still faces resistance at $87.67 to $88.20. Currently, GM looks very strong from a fundamental analysis perspective. Q2 2026 was an exceptional quarter for GM, resulting in management raising their full year guidance for the second time. GM is currently generating strong cash flows and a healthy bottom line. GM management is currently debate whether GM’s cost and discretionary disciplinary control over the mix of vehicles produced will offset GM’s lack of vehicles produced that contain U.S. launched hybrid powertrains.
Q2 Results Confirmed a Strong Core Business
The reported second quarter 2026 results showed revenue of $48.0 billion, EPS of $3.57, and EBIT-adjusted of $3.9 billion. Earnings from North American operations improved to 8.6% of revenue from 6.1% of revenue a year ago.
Healthy average selling prices and strong sales of full-size pickup trucks and large utility vehicles benefitted GM. Management expects the positive trend in pricing and profitability to continue. The positive outlook is reflected in the new EBIT-adjusted guidance range of $14 billion to $16 billion for 2026.
Pickup Strategy Remains a Major Profit Driver
This year General Motors (GM) will release new pickup trucks powered by diesel engines while rivals are leaning more heavily toward hybrids and extended-range systems.
In the fourth quarter of this year, GM will release new models of the Chevrolet Silverado and GMC Sierra. These trucks will have an improved 3.0 liter diesel engine. Some of these trucks will have an optional larger fuel tank that provides more than 900 miles of highway range.
Trucks and SUVs are more profitable for automakers because they have a higher price and larger profit margins.
The cost of fuel will determine how well the diesel trucks sell. The price of diesel fuel in the U.S. is over $6 per gallon and the cost of operating large vehicles with diesel engines increases every year. Other automakers are leaning more heavily toward hybrids and extended-range systems, which could become increasingly attractive if fuel remains expensive.
For GM, they will need to determine if the average consumer will pay more for a vehicle with a larger fuel tank and the ability to tow a heavy load instead of a vehicle with better fuel economy.
Hybrid Weakness Is the Main Competitive Gap
This is currently one of the bigger issues facing the industry. In August, about 19% of U.S. retail vehicle sales were hybrids. General Motors (GM) does not have many hybrid vehicles, and the only one in its line-up is the Corvette. Toyota and Honda are benefitting as consumers do not want to fully give up the internal combustion engine.
GM is losing market share and dealers are concerned they are not selling hybrids.
Management says they will release plug-in hybrids by 2027.
Until then, GM has a product gap.
Most of GM’s vehicles are trucks and SUVs, which should help them be profitable in the near term, but they may need to produce more hybrids in that time if the current trend of consumers buying hybrids continues.
EV Losses Are Improving
GM's upcoming EVs will be less expensive to produce, resulting in smaller losses according to management. Losses are expected to drop by about $1 billion to $1.5 billion in 2026 as a result of improvements in battery and production economics.
GM also benefits from recent policy changes. For example, regulators have eased fuel-efficiency and emissions requirements, allowing automakers more flexibility to sell combustion-engine vehicles. As a result, GM has more flexibility to limit unprofitable EV volume.
This allows GM to continue producing less expensive conventional vehicles to protect its cash flows while improving its production of EVs.
GM Defense Adds a Small but Growing Diversification Angle
The expansion of GM Defense is further evidence of the positive changes occurring at GM. GM Defense has already begun producing critical components for the PAC-3 MSE Patriot interceptor system, delivering its first batch just 22 days after signing a manufacturing agreement with Lockheed Martin.
While the defense division isn't as material as the core auto business to GM, creating a new business line is a positive development. GM can utilize their experience in manufacturing and the defense supply chain to build out other lines of business outside of traditional passenger vehicles.
Management has said that defense revenue could approach $700 million by 2026 and grow rapidly after that.
Fed and Energy Prices Add Macro Risk
Another rate hike in September became a reality. The Federal Reserve raised the target range by 25 basis points on September 16 to 3.75-4.00%. Auto affordability will only get worse with elevated insurance costs and MSRPs.
Wars in the oil producing regions of the world aren't helping, either. High crude prices flow through to the pump and further exacerbate an affordability squeeze on GM's core customer base.
GM is heavily reliant on their lineup of profitable trucks and SUVs, but the continued affordability contraction could decrease demand.
General Motors Technical Analysis: $87.67 Is the Decisive Breakout Level
GM ended at $87.13 on September 17, after touching $87.86 earlier in the day. It traded into the $87.67 - $88.20 resistance zone intraday but closed below it.
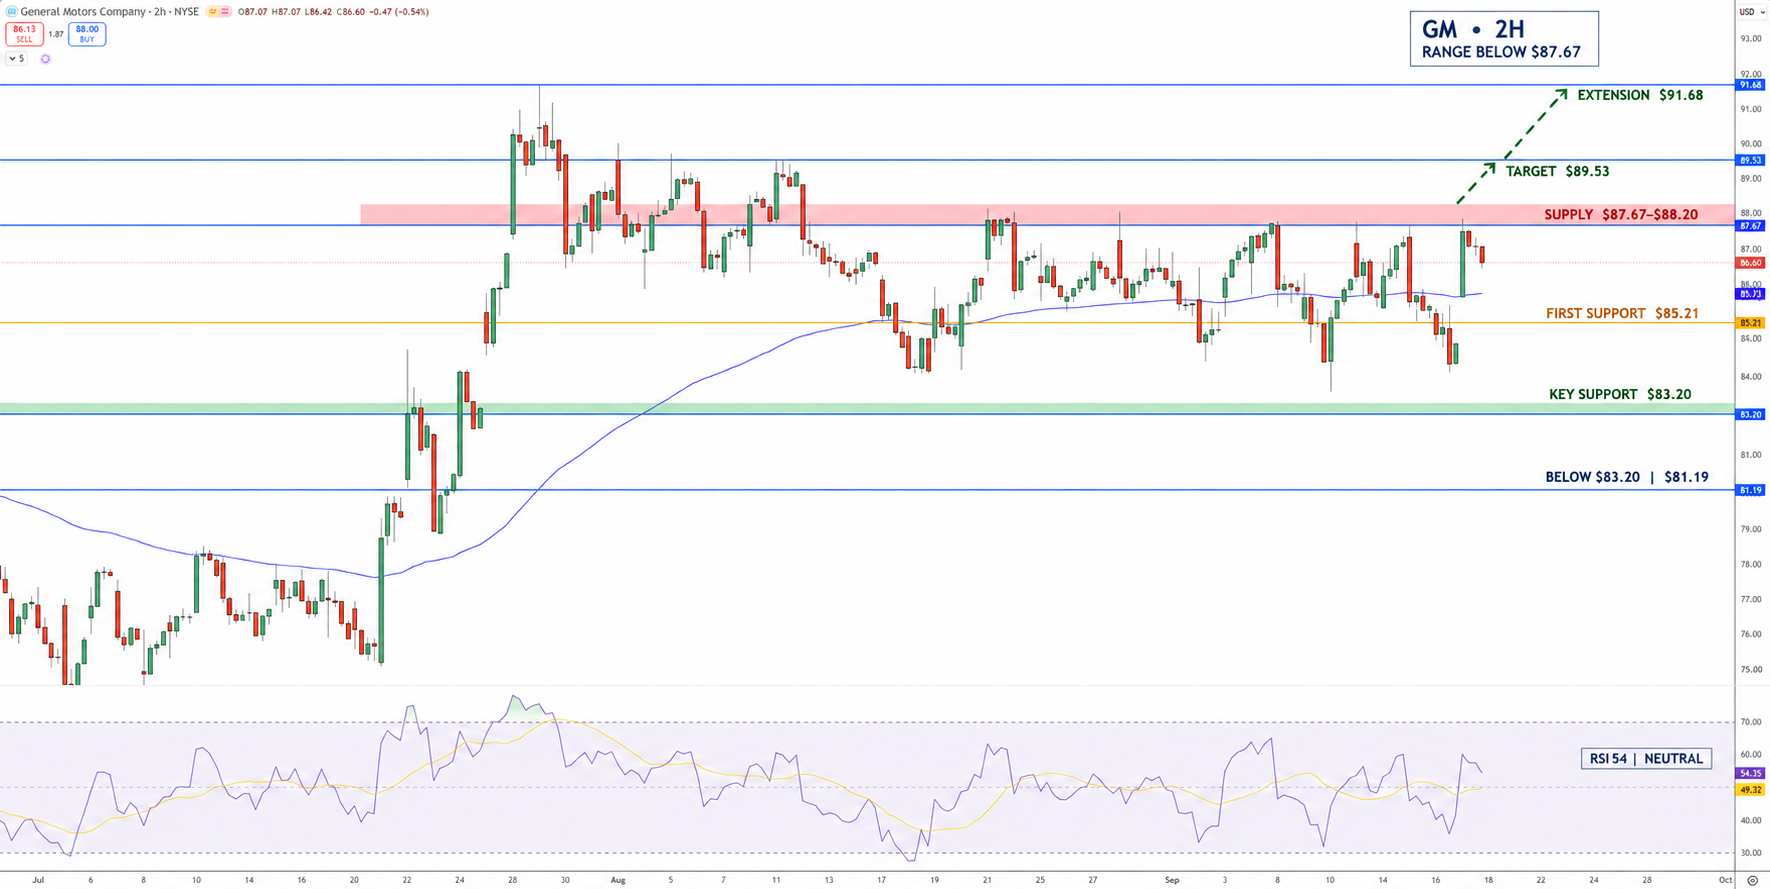
General Motors Price Chart - Source: Tradingview
Price action earlier in the week showed GM slightly above the $86.60 horizontal support, and the 200-day moving average. The 50-day moving average, at $82.40, also supports price action. The Relative Strength Index (RSI) is at 54, slightly above the signal line at 49. The bullish momentum indicates a possible break above the $88.20 resistance level.
The broader chart suggests the 83.20-83.21 support zone and the $89.53 resistance level remain in effect.
Support below $83.20 would open the $81.19 level.
Key Levels
• Latest completed close: $87.13
• Immediate resistance: 87.67-88.20
• First upside target: $89.53
• Higher target: $91.68
• First support: $85.21
• Major support: 83.20-83.21
• Deeper support: $81.19
• RSI: Around 54, mildly bullish but not overbought
Why is General Motors stock in focus now?
GM is very profitable and expects even more profits next year due to the ongoing popularity of trucks and SUVs. Currently, the debate is whether profits from full size pickup trucks, which are typically powered by large V8 engines or smaller-displacement diesel engines, are better than profits from more efficient hybrid vehicles.
What level confirms further GM upside?
There is a good possibility the price of GM stock is going up. An upside breakout beyond the resistance level, currently between $87.67 and $88.20, would be very bullish and possibly lead to an increase beyond $89.53, and possibly to the next major resistance level at $91.68. The best place to buy GM stock is between $83.20 and $85.21. If the price breaks below $83.20, the current bullish structure would weaken materially.
Bottom Line
GM is technically poised to move higher, particularly given improvements in profitability and further cost cutting during the second quarter. Technically, I view $87.67 to $88.20 as the upper limit of the current resistance area. I would look for a break above this level to validate an upside move to $89.53, with $91.68 possible in the next move higher. A break below support between $85.21 and $83.20 would indicate the bulls are not yet in control.
Recommended Articles


