


Micron Stock Price Forecast: Return to $1,000 as RBC Says Valuation Barely Reflects AI Exposure; Can the Stock Continue to Recover?
TradingKey - On September 18 ET, Micron (MU) stock price reclaimed the $1,000 mark after a week.
RBC Capital pointed out that Micron's current valuation barely reflects its exposure to the wave of AI-driven memory demand, leaving room for "substantial" expansion in valuation multiples.
RBC analyst Srini Pajjuri maintained an "Outperform" rating on the stock and a $1,500 price target, citing the continued growth in memory capacity demand from AI workloads, particularly as applications evolve toward more memory-intensive agentic AI.
RBC believes that memory demand remains ahead of available supply, an imbalance supported by multiple structural constraints in the industry: rapid expansion of High Bandwidth Memory (HBM) capacity, limited cleanroom space, and tight supply of Extreme Ultraviolet (EUV) equipment. HBM provides higher memory bandwidth and has become a key component for AI accelerators to meet large-scale model processing demands. Analysts noted that agentic AI features greater autonomy and requires processing multiple tasks in parallel, which could further drive up memory usage.
On valuation, Pajjuri noted that Micron currently trades at roughly 6.5 times expected forward earnings, remaining relatively modest and assigning almost no valuation premium to the company's "strategic customer agreements" and "floor price terms." He believes that sustained AI demand, combined with structural supply constraints and customer agreements, leaves room for significant expansion in Micron's valuation multiples. Strategic customer agreements lock in multi-year supply volumes through take-or-pay structures and set price floors, arrangements that are seen as helping mitigate the impact of traditional cyclical fluctuations in the memory industry on revenue and profit margins.
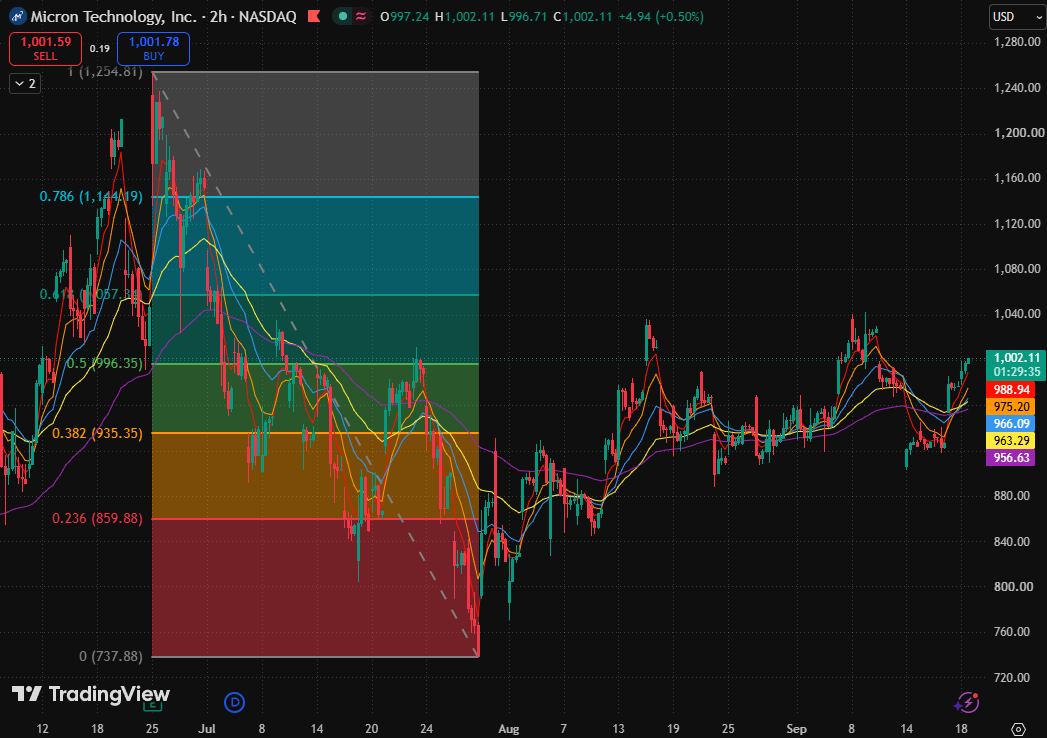
Micron two-hour stock chart, Source: TradingView
Looking at Micron's stock chart, it has just crossed above the 0.5 Fibonacci retracement level ($996.35) and sits above all indicated moving averages, showing short-term strength.
Moving averages have turned bullish in the short term, with short-, medium-, and long-term moving averages neatly ordered: 5-day moving average ($988.94) > 10-day moving average ($975.20) > 20-day moving average ($966.09) > 80-day moving average ($963.29) > 160-day moving average ($956.63). However, the latter three remain clustered in the $966 to $956 range, indicating that the medium-term trend has just turned positive and has not yet widened.
Currently, the most important position is the 0.5 Fibonacci retracement level ($996.35), followed by the 5-day moving average ($988.94), which serves as the nearest dynamic support after turning bullish. Only by holding firmly above these two levels on a continuous basis can the rebound be qualified to target the 0.618 Fibonacci retracement level ($1,057.35).
Recommended Articles


