


The Stock Market Is Flashing a Warning Sign Rarely Seen in 145 Years. Here's What History Says Comes Next.
Key Points
The CAPE ratio is almost 41, a level only exceeded just once before.
A high CAPE ratio shows that stocks are expensive, but it cannot tell investors when or if a crash will happen.
Investors should focus on strong businesses and long holding periods instead of trying to time the market.
- 10 stocks we like better than S&P 500 Index ›
The stock market is rarely boring, but 2026 has seemed especially wild, if you ask me. After narrowly avoiding a correction to begin the year, the S&P 500 (SNPINDEX: ^GSPC) is up 20% from its low in March. The Dow Jones Industrial Average (DJINDICES: ^DJI) and the tech-heavy Nasdaq Composite (NASDAQINDEX: ^IXIC) both slipped into full correction territory -- meaning a decline of 20% or more -- but are now up 16% and 26%, respectively.
All three stock indexes are just a few percentage points off their all-time highs. That has some investors nervous.
Missed AI’s "Act 1"? Act 2 Could Be 15x Bigger. Most investors think they missed the AI boat because they didn't buy Nvidia in 2005. But according to our analysts, we’re only at the end of "Act 1"—the R&D phase. "Act 2" is the global rollout. Continue »
And now, an important stock market indicator has reached a level we've seen only once before -- during the dot-com bubble.
So what does history have to tell us? What should investors do with that information?
The stock market hasn't been this expensive since 1999
That indicator is called the CAPE ratio, or cyclically adjusted price-to-earnings ratio. It helps give you a sense of how expensive the stock market is relative to how well the businesses that make it up are actually doing. The CAPE ratio is calculated by dividing the S&P 500's price by its earnings, averaged over 10 years and adjusted for inflation.
Those last two parts are important because a regular price-to-earnings (P/E) ratio can get thrown off by one great year or one terrible one. The 10-year average strips out some of that noise. Adjusting for inflation lets us compare the present with the past.
The all-time CAPE record was set in December 1999, three months before the market peaked and the dot-com bull market ended. The S&P 500 lost nearly half of its value.
Today's CAPE clocks in at 40.6, down slightly from last month's 41.1. Aside from the dot-com era, the CAPE has never been this high. Its long-run average is just 17.4.
Here's a look covering the past 145 years:
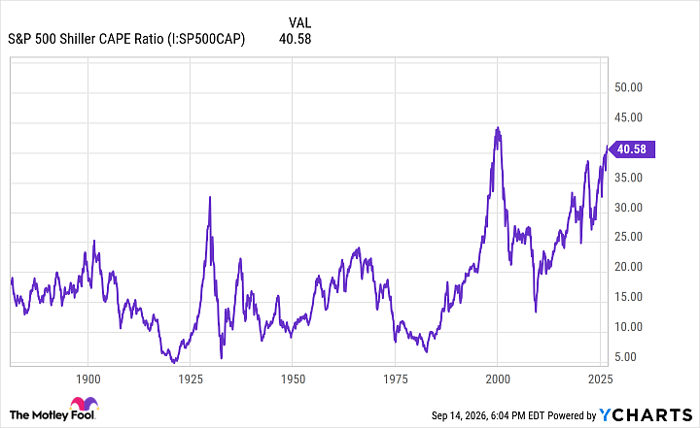
S&P 500 Shiller CAPE Ratio data by YCharts
A high CAPE ratio doesn't mean a crash is coming
So, it would seem that history says what comes next is a crash. But I would be very careful about focusing on one metric -- or any number of metrics -- to predict the future. There is no crystal ball in investing.
Yes, stocks are undoubtedly expensive, but the truth is, the market can stay richly valued for a very long time. An investor who put too much stock in the CAPE ratio during the dot-com era would have sold years before the market turned south, missing out on years of incredible growth.
The real lesson from history is threefold: One, timing the market is nearly impossible, so don't try to do it. Two, solid businesses survive market crashes. And three, in the long run, the stock market will reward steady, patient investing.
Image source: Getty Images.
That's why investors shouldn't focus on predicting exactly when a crash is coming but on making sure their portfolios are made up of businesses they believe in over the long haul. These should be real, cash-producing businesses whose stock prices aren't based on what the companies might do a decade from now if everything goes right, but on what they are doing this year. If a stock needs flawless growth and cheap financing to justify its price, that should give you pause.
Staying invested over the long haul pays
From its March 24, 2000, peak through Sept. 10, 2026, the S&P 500 gained roughly 397%. The Nasdaq Composite, made up of many of the tech companies that were hit hardest, climbed more than fivefold from its own March 10, 2000, peak. A hypothetical $1,000 investment tracking the S&P 500 index would now be worth roughly $4,970. The same amount tracking the Nasdaq Composite would be worth about $5,170 -- and that's without adding another cent along the way.
Of course, this doesn't mean a crash is painless -- far from it -- but it's a reminder that, if we look to history, even investors with the worst possible timing can make great money with enough patience and time.
Should you buy stock in S&P 500 Index right now?
Before you buy stock in S&P 500 Index, consider this:
The Motley Fool Stock Advisor analyst team just identified what they believe are the 10 best stocks for investors to buy now… and S&P 500 Index wasn’t one of them. The 10 stocks that made the cut could produce monster returns in the coming years.
Consider when Netflix made this list on December 17, 2004... if you invested $1,000 at the time of our recommendation, you’d have $433,160!* Or when Nvidia made this list on April 15, 2005... if you invested $1,000 at the time of our recommendation, you’d have $1,296,254!*
Now, it’s worth noting Stock Advisor’s total average return is 949% — a market-crushing outperformance compared to 212% for the S&P 500. Don't miss the latest top 10 list, available with Stock Advisor, and join an investing community built by individual investors for individual investors.
See the 10 stocks »
*Stock Advisor returns as of September 16, 2026.
Johnny Rice has no position in any of the stocks mentioned. The Motley Fool has no position in any of the stocks mentioned. The Motley Fool has a disclosure policy.
Recommended Articles


