


This Market Indicator Is Sending a Warning Signal to Investors. Here's What History Says the S&P 500 Does Next.
Key Points
The Shiller CAPE ratio is as high as it's been since 2000, right before the dot-com bubble burst.
The ratio compares the S&P 500 to the index's inflation-adjusted 10-year average earnings.
History often rhymes, but don't count on a repeat.
- 10 stocks we like better than S&P 500 Index ›
Although there's been some pullbacks along the way, the stock market has gone up and to the right since the start of 2023.
This year, the broader benchmark S&P 500 (SNPINDEX: ^GSPC) is up more than 12% (as of Sept. 9), and that's despite some pretty significant challenges, including the Iran war, which has led oil prices to soar. It also includes trade wars, elevated inflation, a potential interest rate hike, and concerns about artificial intelligence (AI).
Missed Nvidia in 2009? This Rare Signal Is Flashing Again. In 2009, a "Double Down" signal flashed for a little-known chipmaker called Nvidia. For the first time in years, that same "Total Conviction" signal is flashing for a company 1/100th the size of Nvidia. Continue »
However, continued earnings growth, largely on the back of the AI infrastructure build-out, has helped the S&P 500 overcome these potential drags and deliver solid performance overall.
But that doesn't mean there aren't still worries. In fact, one market indicator in particular is sending a clear warning signal to investors. Here's what history says the S&P 500 Index will do next.

Image source: Getty Images.
The Shiller CAPE Ratio is sending the market an obvious warning sign
Investors use many data points and metrics, whether it's to track individual stocks or a broader benchmark. One for the S&P 500 specifically is the Shiller CAPE ratio, which compares the S&P 500's value to its inflation-adjusted 10-year average earnings.
The concept is somewhat similar to a price-to-earnings (P/E) ratio, but the Shiller CAPE adjusts for inflation and uses a 10-year average to smooth out irregularities that will inevitably occur across a business cycle.
For instance, in some years there might be strong gross domestic product (GDP) growth, while in others there might be weak growth. There can also be erratic events that affect the entire market and economy, such as the COVID-19 pandemic, which then led to the highest inflation in 40 years in 2022.
The point being, you never want to rely on just one year's earnings to tell an entire story.
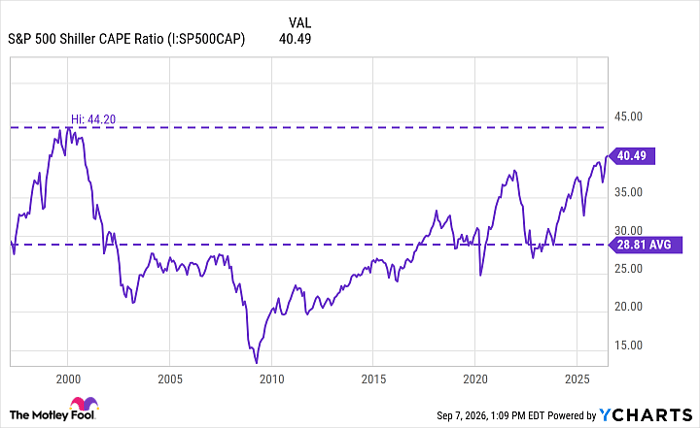
S&P 500 Shiller CAPE Ratio data by YCharts
As shown above, the Shiller CAPE ratio is now more than 40, well above its long-term average, and not too far from levels seen in 2000, right before the dot-com bubble burst, which led to a major sell-off.
Here's what happens next, according to history
Investors have frequently cited similarities between the current AI revolution and the internet bubble of 2000. Both were driven by game-changing technologies that would go on to disrupt society as we know it.
Both cycles also involve spending exorbitant amounts of money to build the infrastructure that powers these technologies. When the dot-com bubble burst in 2000, here's what happened to the S&P 500 and the tech-heavy Nasdaq Composite during the next few years.
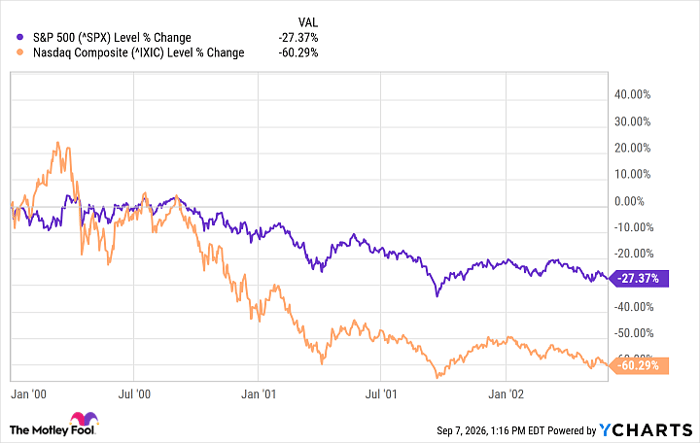
^SPX data by YCharts
Many internet start-ups went bankrupt, while even large, established tech companies saw their stocks get crushed.
Now, as most know, stocks would eventually recover, but it didn't happen overnight. In fact, it took the Nasdaq 15 years to return to its previous high levels right before the dot-com bubble burst.
So, if history repeats, the S&P 500 has a little more room to move higher before a severe pullback, which it would then regain over time. However, it's also important for investors to note that while history often rhymes, it rarely repeats.
A negative for the S&P 500 is that it is more heavily concentrated in AI companies today than it was during the dot-com era.
Today, the 10 largest companies in the S&P 500, most of which are AI companies, make up roughly 40% of the index. In the dot-com era, the top 10 made up only 25%, according to UBS.
So if the AI bubble bursts, the S&P 500 could take a bigger hit today. However, I also think it's worth noting that everything seems to move much more quickly today, perhaps because of the internet and the degree to which trading has become digitized.
Even during these past three years, the market has experienced some severe sell-offs due to the Silicon Valley Bank crash in 2023, President Donald Trump's major tariff announcement in April 2025, and the Iran war this year.
All this is to say that nobody knows for sure what will happen.
Similar to the dot-com bubble, I do think the S&P 500 will experience a severe sell-off, likely driven by some issue with AI. Similar to the dot-com bust, I fully expect the market to recover and for AI to continue to fundamentally reshape the world.
Should you buy stock in S&P 500 Index right now?
Before you buy stock in S&P 500 Index, consider this:
The Motley Fool Stock Advisor analyst team just identified what they believe are the 10 best stocks for investors to buy now… and S&P 500 Index wasn’t one of them. The 10 stocks that made the cut could produce monster returns in the coming years.
Consider when Netflix made this list on December 17, 2004... if you invested $1,000 at the time of our recommendation, you’d have $414,015!* Or when Nvidia made this list on April 15, 2005... if you invested $1,000 at the time of our recommendation, you’d have $1,385,459!*
Now, it’s worth noting Stock Advisor’s total average return is 960% — a market-crushing outperformance compared to 213% for the S&P 500. Don't miss the latest top 10 list, available with Stock Advisor, and join an investing community built by individual investors for individual investors.
See the 10 stocks »
*Stock Advisor returns as of September 10, 2026.
Bram Berkowitz has no position in any of the stocks mentioned. The Motley Fool has no position in any of the stocks mentioned. The Motley Fool has a disclosure policy.
Recommended Articles


