


US August PPI Preview: Producer Inflation May Reaccelerate, How Will US Stocks, Dollar, and Gold React?

TradingKey - The U.S. Bureau of Labor Statistics will release the August Producer Price Index (PPI) at 8:30 a.m. ET on September 10. Against the backdrop of U.S. August non-farm payrolls significantly exceeding expectations, a rebound in the probability of a September Fed rate hike, and international oil prices returning to $100, this data will serve as an important indicator for gauging U.S. inflationary pressures this week and provide further reference for the August CPI to be released a day later.
Oil Tops $100 as Producer Inflation May Reaccelerate
The market currently expects US headline PPI for August to rise 0.4% month-over-month, significantly higher than July's 0.0%, with the year-over-year growth rate expected to increase to 5.3% from 4.7%. Core PPI is expected to rise 0.3% month-over-month, up from 0.2% in July, while the year-over-year rate is projected to climb to 4.6% from 4.2%.
Based on July data, overall US PPI performance was relatively mild. Data from the US Bureau of Labor Statistics showed that final demand PPI was flat month-over-month in July and rose 4.7% year-over-year. Among components, final demand goods prices fell 0.7%, energy prices dropped 3.1%, and gasoline prices plummeted 5.7%, offsetting a 0.2% increase in service prices.
However, not all sub-indexes in the July data showed a significant easing of inflationary pressures. PPI excluding food, energy, and trade services rose 0.4% month-over-month and 4.7% year-over-year, indicating that cost pressures in certain services and baseline inputs persist.
Moving into August, the energy price environment shifted. Some institutions currently expect August energy PPI to rise by around 2.2%, while food prices may reverse July's decline to post a slight increase. Service prices are also expected to accelerate compared to July. Consequently, the market's current forecast of a 0.4% month-over-month increase in headline PPI largely reflects a rebound in energy prices and a recovery in certain service costs.
Meanwhile, Brent crude oil broke through $100 intraday on September 9. Whether higher energy costs are beginning to be reflected more clearly in US producer prices will be a key focus of this PPI report. However, there is a time lag in the pass-through of rising energy prices to core services and final consumer prices, so the PPI data alone is not yet sufficient to confirm a broad re-acceleration of US inflation trends.
In terms of data interpretation, if headline PPI exceeds 0.4% and core PPI comes in above 0.3%—especially if both service and core goods prices strengthen simultaneously—it would indicate that producer-level price pressures are higher than current market expectations. Conversely, if the rise in headline PPI is driven primarily by energy while core PPI remains muted, the impact on Federal Reserve policy expectations may be relatively limited.
If PPI comes in significantly below expectations, it would suggest that even with rising energy prices, overall producer-level cost pressures for US businesses have not expanded significantly.
How Does PPI Data Impact US Stocks, the Dollar, and Gold?
In terms of U.S. equities, if August PPI is significantly higher than market expectations, especially if core PPI increases by more than 0.3% month-over-month, it could further reinforce market expectations for a Fed rate hike in September and keep U.S. Treasury yields elevated, putting pressure on tech and growth stocks with higher valuations and interest-rate sensitivity, with the Nasdaq Index likely showing a more pronounced reaction. If PPI comes in below expectations, market pricing for a rate hike may decline, and a retreat in U.S. Treasury yields would help ease valuation pressure on tech stocks. However, as the more critical August CPI will be released a day later, if PPI merely aligns with expectations for a headline month-over-month increase of 0.4% and a core increase of 0.3%, U.S. equities may largely stay range-bound, awaiting CPI to further confirm the inflation trend.
For the U.S. dollar, the impact of PPI will mainly depend on whether the data changes U.S. interest rate expectations. If both headline and core PPI exceed expectations, particularly if core producer prices accelerate noticeably, Fed rate hike expectations and short-term U.S. Treasury yields could be supported, thereby benefiting the U.S. dollar. Conversely, if PPI is significantly lower than expected, the market may reduce the probability of a September rate hike, placing pressure on the dollar. It is worth noting that if higher headline PPI stems mainly from energy prices while core PPI remains modest, the boost to the U.S. dollar may be relatively limited.
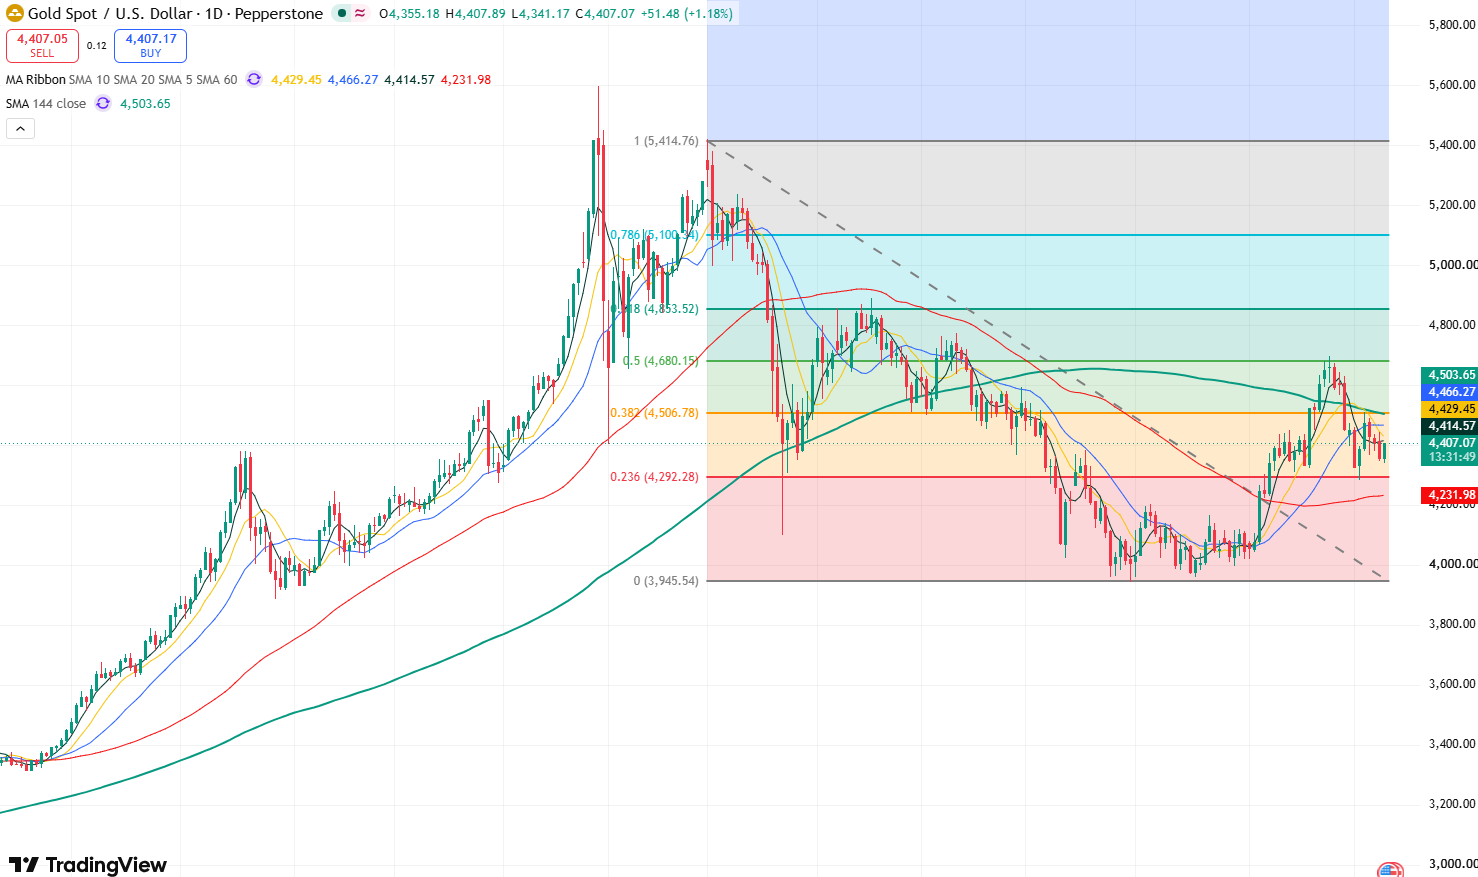
Gold Price Daily Chart, Source: TradingView
As for gold (XAUUSD), if August PPI significantly exceeds expectations and drives up Fed rate hike expectations and U.S. Treasury yields, gold may come under pressure and pull back, with short-term attention focusing on the $4,300–$4,350 area; if PPI falls short of expectations, leading the market to scale back some rate hike bets while U.S. Treasury yields retreat, it would favor a rebound in gold to test resistance near $4,450. However, because CPI will be released a day after PPI, even if PPI deviates significantly from expectations, gold's reaction to the data may still be affected by investors waiting for CPI.
Read more
* The content presented above, whether from a third party or not, is considered as general advice only. This article should not be construed as containing investment advice, investment recommendations, an offer of or solicitation for any transactions in financial instruments.


