


Nvidia Stock Price Forecast: FY2028 70% Revenue Growth Guidance Is Just a Floor, Stock Expected to Target All-Time High of $236
TradingKey - JPMorgan analyst Harlan Sur noted that Nvidia's (NVDA) framework of 70% year-over-year growth in FY28 is not an upper limit on demand; without supply constraints, business growth could have exceeded 100%. A key reason management provided a multi-year growth framework in advance is the significant gap between market consensus expectations and internal company projections.
The implication of Hari's remarks is that the 70% growth rate is more like a growth floor that the company is willing to publicly confirm under current supply conditions, rather than an upper limit on demand. As production capacity is further released, Nvidia's actual growth potential could be significantly higher than this figure.
This indicates that the core bottleneck constraining Nvidia's growth is shifting from "whether demand is sustainable" to "whether production capacity can keep up."
AI Demand Continues Expanding Rapidly as Inference Revenue Surpasses Training Revenue
About 18 months ago, Nvidia's revenue was split roughly equally between training and inference. Currently, inference revenue has surpassed training, and this gap is expected to widen further.
This means that AI demand is shifting from "purchasing compute for infrastructure build-out" to ongoing compute consumption, with inference becoming a more stable source of demand that is expected to further enhance the sustainability of Nvidia's revenue.
Meanwhile, changes in customer structure are easing market concerns over Nvidia's over-reliance on a few major clients. Hari disclosed that OpenAI and Anthropic account for roughly 20% of Nvidia's business on an end-consumption basis, a figure that could rise to about 25% by FY28.
More notably, AI computing infrastructure revenue (ACIE) contributed by emerging cloud providers has exceeded 50%—growth momentum is spreading from a few hyperscalers to emerging cloud providers, model companies, and enterprise clients. The continuous diversification of customers and compute demand is reducing risks associated with single-customer concentration.
Overall, Nvidia's growth story is transitioning from a pure "training compute cycle" to a broader AI infrastructure cycle.
Supply Side Is Key: Advanced Wafers and HBM Limit Revenue Growth
Amid robust demand, Nvidia's biggest challenge currently stems from the supply chain. Hari noted that the key constraints in meeting next year's demand are concentrated in two major areas: advanced wafers and memory. Advanced wafers rely primarily on TSMC, while high-bandwidth memory such as HBM involves Micron, SK Hynix, and Samsung.
Nvidia is continuously coordinating with TSMC and the three major memory manufacturers, focusing on boosting the supply capacity of key components. Against the backdrop of ongoing tightness in HBM supply, once the supply of key components improves, order demand previously suppressed by capacity constraints is expected to be further released; for HBM suppliers like Micron and SK Hynix, demand visibility from Nvidia remains high.
Wall Street Average Price Target Is $329, Implying About 46% Upside
After Nvidia delivered an earnings report that beat expectations across the board, Wall Street investment banks raised their price targets in quick succession. Among them, JPMorgan reiterated its "Overweight" rating and $320 price target for Nvidia.
Morgan Stanley raised Nvidia's revenue forecasts for FY2028 and FY2029 by approximately $100 billion and $200 billion, respectively, naming the company its top pick in the semiconductor sector. It raised its price target from $288 to $300 and maintained its "Overweight" rating.
RBC Capital Markets raised its price target on Nvidia to $330 and maintained an "Outperform" rating, citing strong demand visibility.
UBS also raised its price target to $300, emphasizing that Nvidia's strong performance and guidance indicate that its future earnings per share could exceed $16.
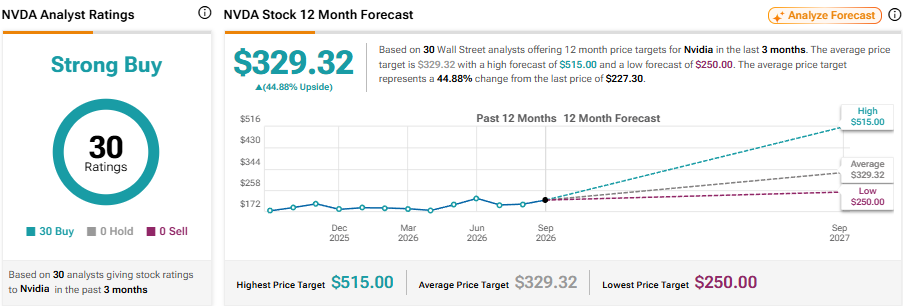
Source: TipRanks
According to TipRanks, multiple investment banks are highly optimistic about Nvidia's prospects, giving it an overall consensus rating of "Strong Buy". Over the past three months, a total of 30 analysts have rated Nvidia, with the highest price target at $515, representing an upside of about 127% from current levels. The lowest price target is $250.00, which also implies an upside of about 10%, while the average price target stands at $329.32.
Nvidia Technical Analysis
Nvidia's stock price rebounded from near $189.80, recently reclaiming the 0.618 Fibonacci retracement level ($218.16), and is standing above short-, medium-, and long-term moving averages: the 5-day moving average ($220.33), 10-day moving average ($218.97), 20-day moving average ($217.05), 80-day moving average ($213.78), and 160-day moving average ($209.24).
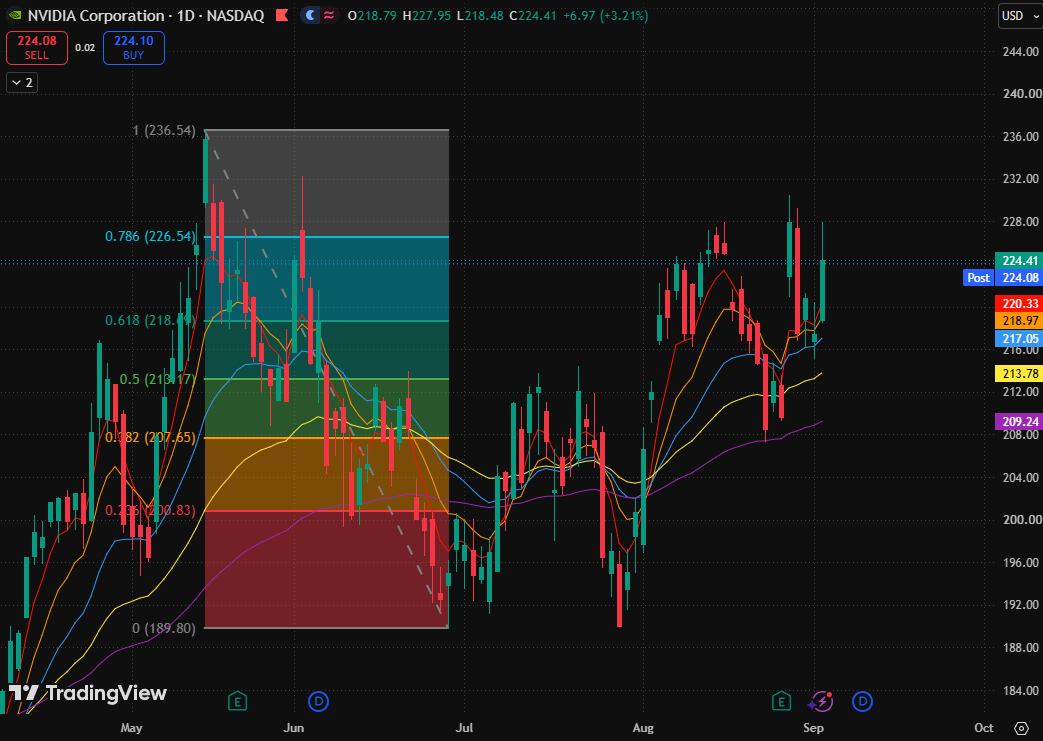
Nvidia daily chart, Source: TradingView
From the daily chart structure, Nvidia's recent lows and highs have generally moved higher, indicating a significant strengthening in short-term rebound momentum. Meanwhile, the short-term moving average structure is bullish, suggesting that the medium-term trend has not been significantly damaged for now.
However, it is worth noting that although the stock price reclaimed the 0.618 Fibonacci retracement level ($218.16) and intraday breached the 0.786 Fibonacci retracement level ($226.54), it failed to firmly close above this position. The next key observation is whether it can break through this price level and confirm during a pullback that this level turns from resistance into support.
If the stock subsequently holds firmly above the 0.786 Fibonacci retracement level ($226.54), upside potential will open up toward the all-time high of $236.
If the push higher near $226.54 encounters resistance, the stock price may first pull back to near the 5-day moving average ($220.33) and the 0.618 Fibonacci retracement level ($218.16). If the support zone between $213.78 and $213.17, formed by the 80-day moving average and the 0.5 Fibonacci retracement level, is also effectively broken below, the trend may enter a deeper technical correction.
Recommended Articles


