


Palantir (PLTR): Extended Breakout to $177.67, $183.15 Next, RSI 74 Overbought Warning
TradingKey - Palantir (PLTR) broke out of the multi-month symmetrical triangle. In the late US trading on August 10, the stock was touching $177.67. In anticipation of profit-taking, Palantir's stock had broken through the $145.48, $157.99, $171.04 resistance levels. The $183.15 price level would confirm the breakout and target the $196.32 and $206.95 price levels. The $206.95 price level would be the psychologically significant price level of $200. The stock is in the overbought territory with an RSI value of 74.7, and with the stock having rallied $48 from $130 to $177.67 in the prior week, a pullback to the $171.04 price level would not be out of the question and would be perceived as healthy.
When the Asian traders open on August 11, the picture that will be presented is that the bulls will be able to target $183.15 with a breakout past that level, and the bears would be able to defend that level and target a pullback to the $171.04 price level. The stock's fundamentals remain strong, with 93% revenue growth, a Rule of 40 score of 155%, and a remaining deal value of $6.24 billion. The stock's technicals remain risky due to its overbought condition.
The Fundamental Case Remains Exceptional
Let’s look at earnings.
In Q2 of 2026, Palantir achieved $1.935 billion in revenue. The year-on-year growth was 93% and consensus was beaten by the forecast of $1.80 billion. U.S. commercial revenue grew by 149%, reaching $764 million, and is the fastest growing area and the main driver of the thesis. U.S. government revenue grew by 90%, reaching $809 million. The GAAP operating margin was 47%.
The non-GAAP operating margin was 62%. The Rule of 40, which combines revenue growth and operating margin, scored 155%. For perspective, 40 is deemed a good performance by the software industry. Scoring 155 exemplifies the elite execution of Palantir.
It is corroborated by the backlog. In Q2, Palantir achieved $3.37 billion in total contracts, a 49% year-on-year increase. In the U.S. commercial area, total contracts were a record $2.13 billion. With remaining deal value at $6.24 billion, there is a strong expectation that the U.S. commercial area will grow by 100% (triple digits) for the next two quarters, at least. This expectation is based on active contracts that are revenue waiting to be recognized.
Technical Setup: Overbought But Not Yet Showing Distribution
Palantir has risen through the consolidation triangle, overcoming resistance at $145.48, $157.99, and $171.04, all on higher volume. Now, trading near $177.67, well above the 50-day EMA at $136.57 and the 100-day EMA at $138.96, confirms the strong bullish trend.
The RSI is at 74.7 and technically reads as overbought, but that does not indicate an immediate reversal. The focus is on whether $171.04 will remain intact if a pullback occurs. If $171.04 does remain intact, the up move will continue to $183.15, then on to $196.32 and $206.95.
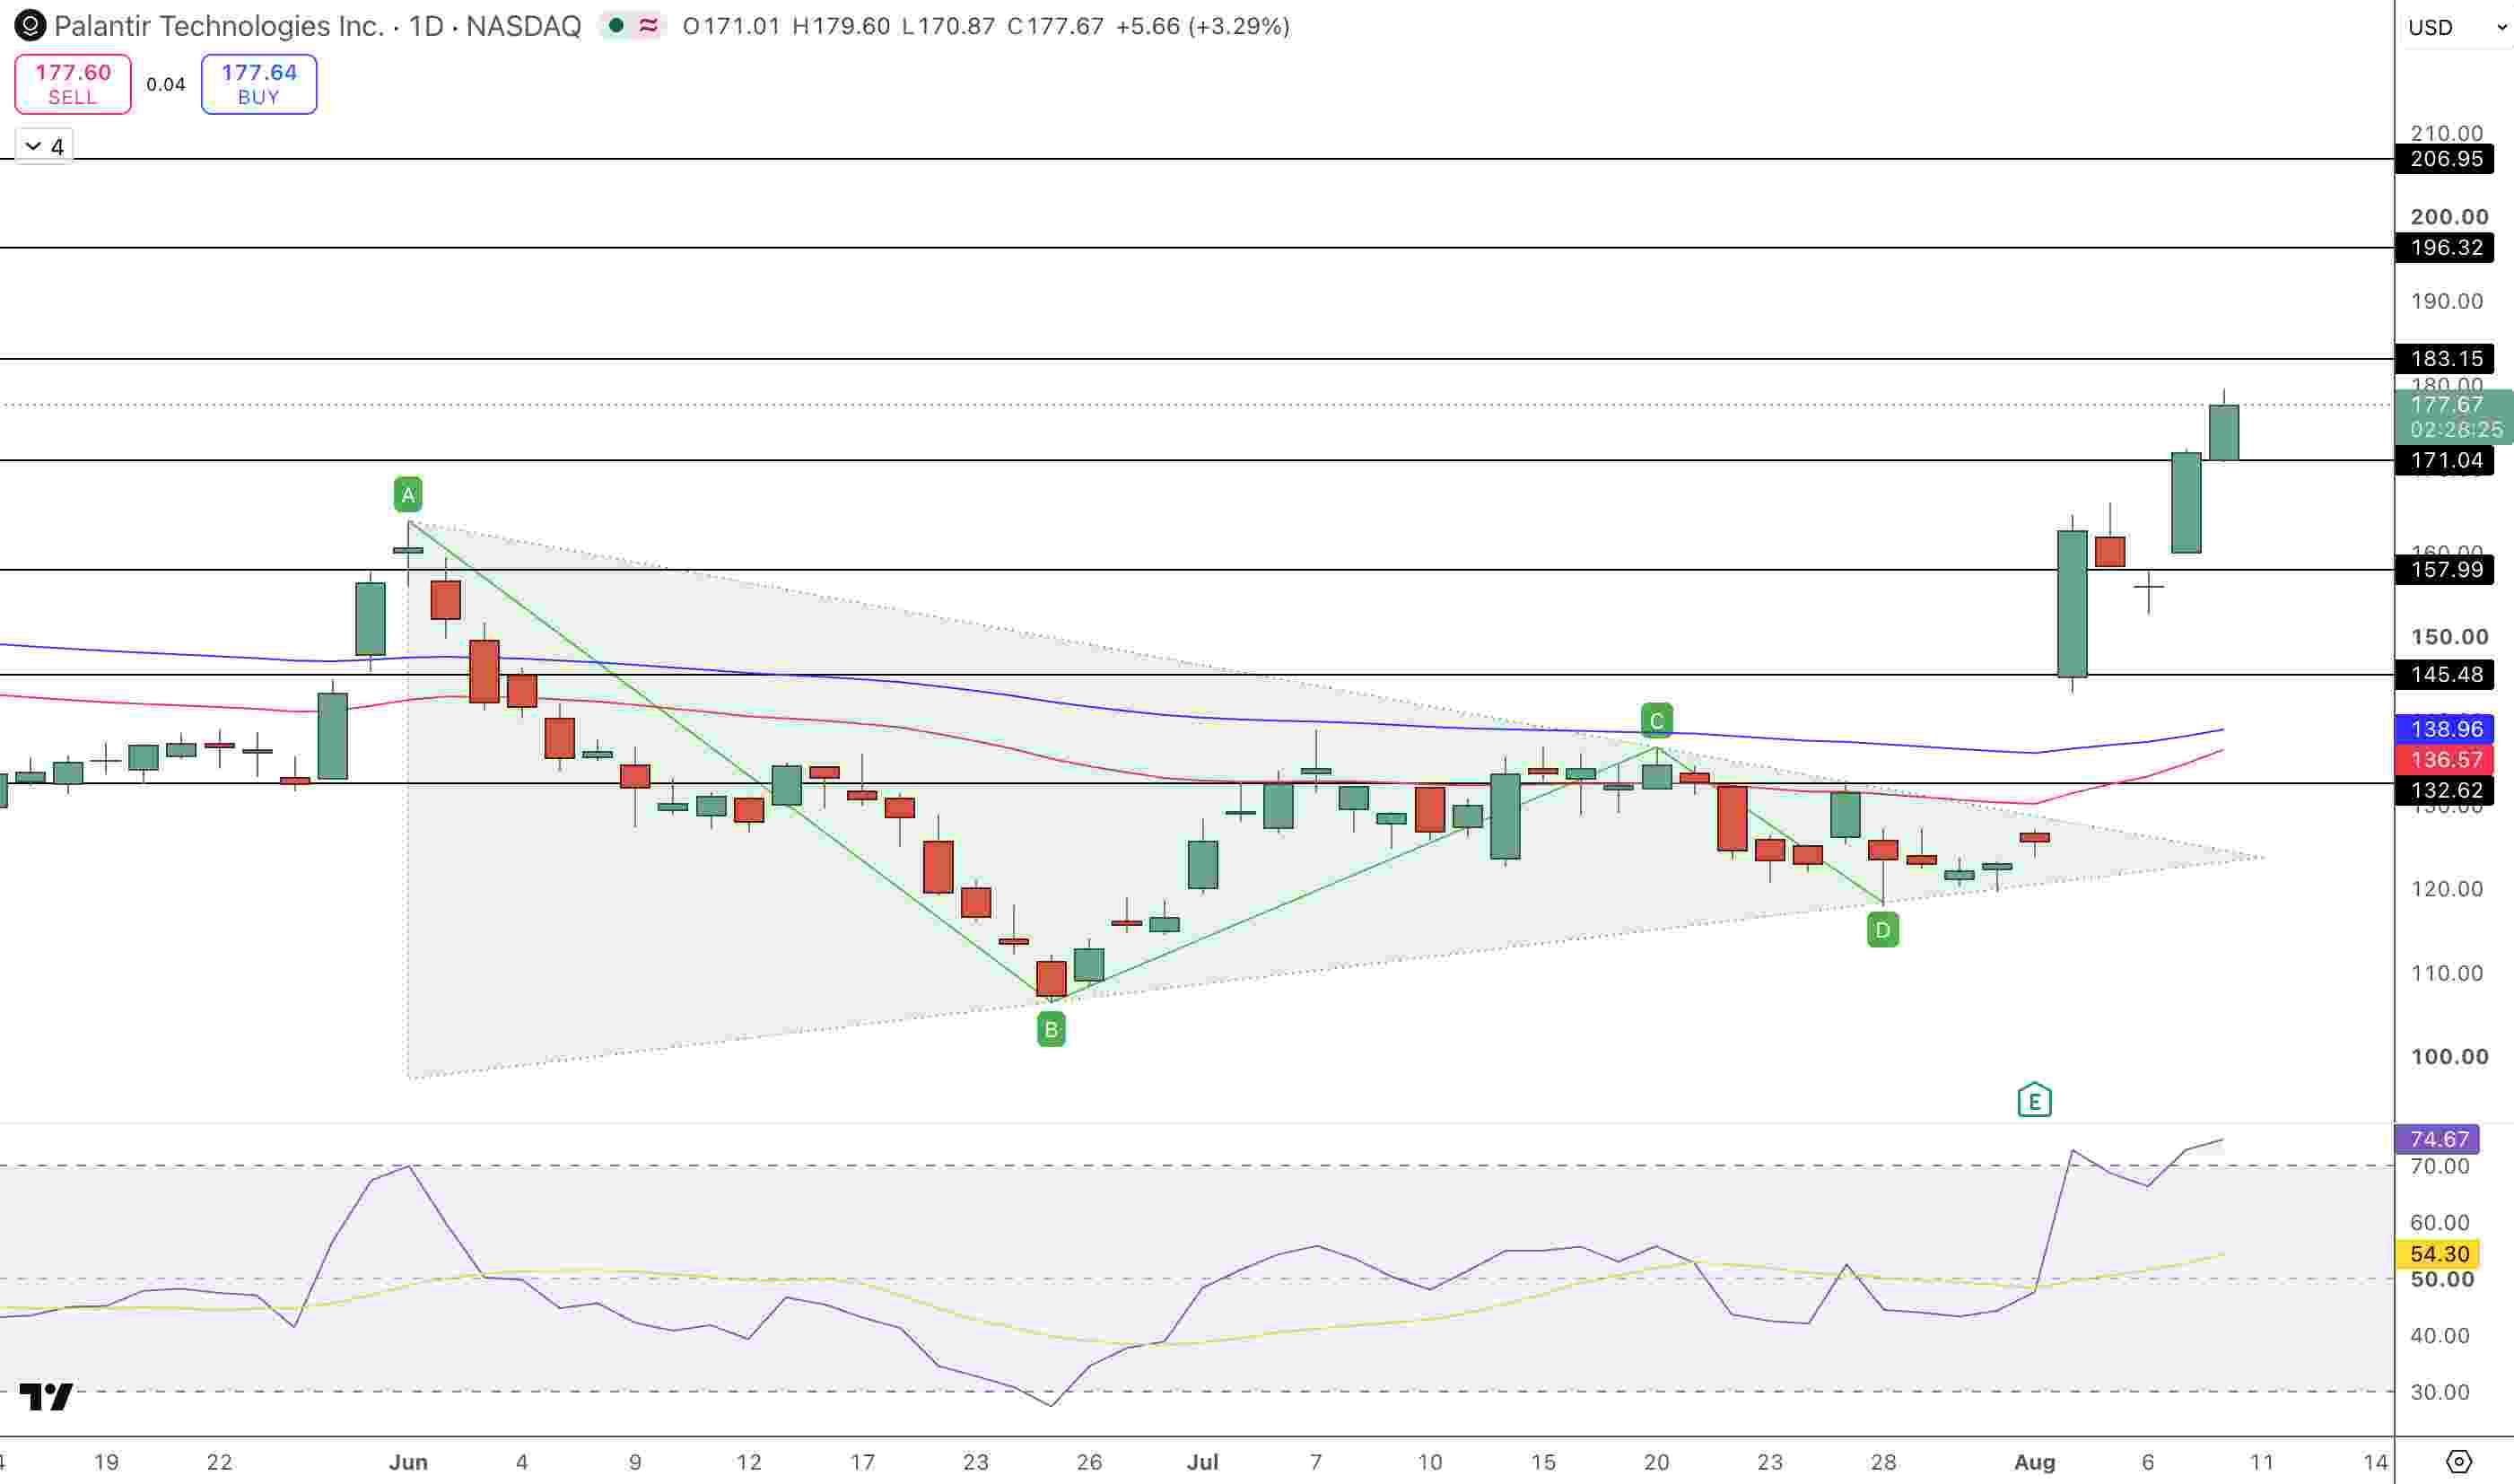
PLTR Price Chart - Source: Tradingview
A pullback below $171.04 will cause a breakdown of the current setup, exposing $157.99. A breakdown of $157.99 will bring the negative scenario of a pullback to $145.48.
Key Levels — August 11 Asian Session
Resistance is at $183.15, $196.32, and $206.95. Support is at $171.04, $157.99, and $145.48. As long as prices remain above $171.04, the bullish structure will remain, though because of an increased RSI, higher likelihood of a short-term pullback.
What Happens at $183.15?
This is the most important price level to watch. If PLTR closes above $183.15 on increased volume, it will confirm that the breakout has momentum and that $196.32 and $206.95 will be next. If it fails at $183.15, and closes below, we will enter a period of consolidation. The trend will almost certainly be upwards during a consolidation. Consolidating at major resistance is an opportunity for buyers that were coming in late to the trend to take profit, and gives a chance for new buyers to enter. It also allows the momentum to reset to provide enough strength for the next major movement of the trend.
What Happens at $171.04 (on Pullback)?
When PLTR pulls back to $171.04 support, that would become an important level. If buyers step in to defend $171.04 and the stock bounces, that would imply just a consolidation and the bounce structure would remain intact. A break of that support level would retrace the bounce from $145. For this reason, more aggressive short-sellers would have their stops set above $171 and targets at $157–$145. More conservative, long-sellers would consider a break below $171 as a signal to stand back and wait for a better buy signal, rather than trying to catch the falling knife.
The Valuation Question
Palantir's stock, at $177.67, trades at roughly 107 times earnings. While this is pricey historically, the valuation could make sense if the company achieves sustained profitability at 50%+ operating margins and U.S. commercial growth remains at 149%. The company appears to have a lot of backlog and the potential to grow earnings. However, the stock is highly sensitive: it is a ‘perfection or nothing’ scenario. Any earnings miss, slowdown, or geopolitical event that impacts spending will likely negatively affect the stock.
The risk/reward balance has changed compared to three weeks ago. At that time, the stock was at $140, and the setup was asymmetric with a lot of potential upside and a small stop loss. Now, at $177.67, the setup has changed. The potential upside at a break of $183.15 is minimal. Better entries for those who did not take a position on the initial move will be at $171.04 or $157.99.
The Bottom Line
Palantir's stock has broken out both fundamentally and technically. The stock is up an extreme 48 points over the past week and is now in the overbought territory (RSI 74.7). The next target is $183.15. From that level, the move could go to $196–206. Increased stakes are on the level of $171.04, the previous level of resistance. If it breaks, previous conditions of the sell-off will be reestablished.
For those trading the Asian market, the technical conditions are not very good. The situation is overbought and momentum is slowing, although there are no clear signs of selling pressure. The level of $183.15 must be broken for a sustained move to $196+. If that level is not broken and the market retests $171.04, that is positive. A break of $171.04 would indicate a failed breakout.
For those impressed with the 93% revenue surge, the 155% Rule of 40, and the $6.24B backlog: consider the breakout at $183.15, or buy the pullback at $171.04. Do not buy the $177.67 pull at an overbought price. This is analysis, not advice.
Nothing has changed fundamentally. Things have stretched on the technical end. While valid, the breakout has wear. Bulls will have to show strength over the next two sessions to hold the price at $183.15. Otherwise, we can expect consolidation.
Recommended Articles


