


If a Stock Market Crash Is on the Horizon, History Says Investing in This 1 Thing is the Smartest Opportunity Right Now
Key Points
U.S. GDP growth is slowing, while participation in the labor market remains historically low.
Analyzing the performances of stocks during recent crashes shows a clear pattern.
Smart investors understand that investing through volatility can be a winning strategy in the long run.
- 10 stocks we like better than S&P 500 Index ›
The U.S. economy currently presents a mixed bag. Real gross domestic product (GDP) expanded at an annualized rate of just 1.5% during the second quarter -- a deceleration from 2.1% in the first quarter. The labor market has also cooled noticeably: Nonfarm payrolls rose by only 57,000 in June, while the unemployment rate ticked down to 4.2% and the participation rate fell to 61.6% -- its lowest level in more than five years.
Meanwhile, geopolitical tensions in the Middle East have repeatedly jolted oil and energy markets, feeding inflation pressures that ripple through transportation, manufacturing, and consumer goods.
Missed Nvidia in 2009? This Rare Signal Is Flashing Again. In 2009, a "Double Down" signal flashed for a little-known chipmaker called Nvidia. For the first time in years, that same "Total Conviction" signal is flashing for a company 1/100th the size of Nvidia. Continue »
Even with all of this uncertainty, the S&P 500 (SNPINDEX: ^GSPC) has continued climbing to new highs. Nevertheless, the combination of decelerating economic growth, softer hiring, and energy volatility is leaving many investors wondering whether a crash could arrive at a moment's notice.
Image source: Getty Images.
What is a stock market crash?
A stock market crash is typically defined as a rapid decline in stock prices, often exceeding 20% from recent peaks, and can last for weeks or even months. A crash differs from ordinary corrections in both speed and depth and is usually triggered by a sudden loss of confidence that ripples through leveraged positions, forcing panic selling.
The 2008 financial crisis is one of the clearest examples of a crash in modern history. Years of loose lending standards fueled a housing bubble, during which subprime mortgages defaulted en masse and complex derivative securities tied to those loans collapsed. The failure of Lehman Brothers and Bear Stearns ultimately led to a freeze in credit markets and permeated throughout equity markets as well, turning a housing problem into a full-blown economic disaster.
A more recent episode occurred at the onset of the COVID-19 pandemic in early 2020. Global lockdowns shuttered businesses overnight, fueling a rise in unemployment claims and widespread fear of prolonged economic paralysis. Although the COVID recession lasted only a few months, the speed of the sell-off illustrated how external shocks can produce crash-like conditions even without the gradual buildup.
How do stocks usually perform during and after a crash?
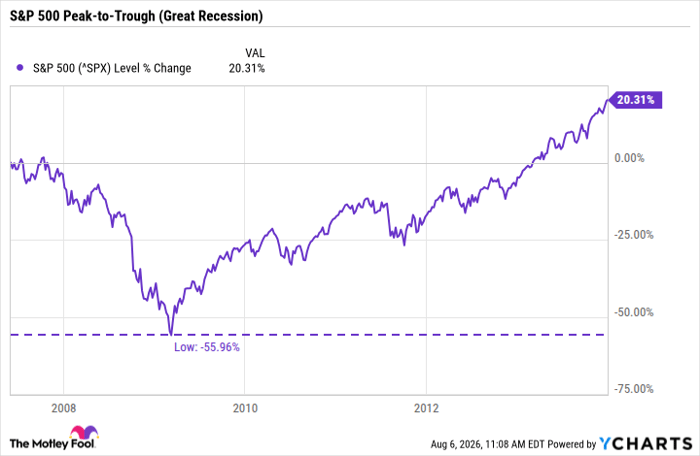
During the 2008 crisis, the S&P 500 fell 56% from its October 2007 peak to its March 2009 low. The index did not reclaim that prior high until 2013, nearly four years later.
^SPX data by YCharts
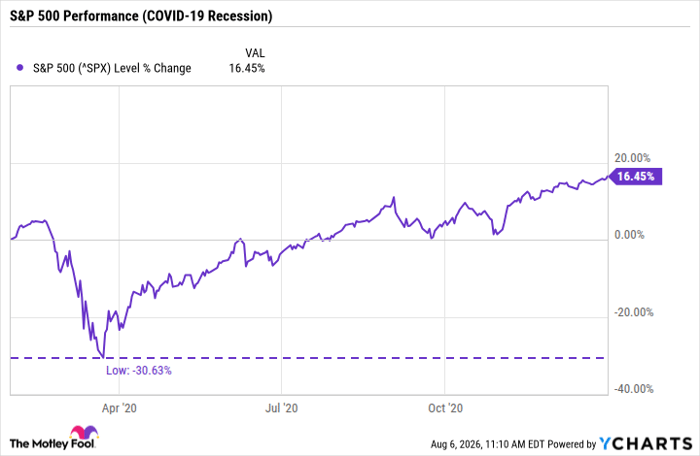
During the COVID-19 pandemic, the decline was more pronounced in calendar time: The S&P 500 dropped by more than 30% in a little over a month. In both instances, once a recovery took hold, the S&P 500 advanced steadily -- ultimately delivering meaningful gains for those who remained invested.
^SPX data by YCharts
A consistent pattern emerges across both of these cases: The stock market frequently anticipates economic bottoms and begins to rise while conditions still look bleak. After downturns subside, stock prices not only recover lost ground but also push to new highs.
Stay invested in the S&P 500 for the long term
History shows that, faced with the possibility of another economic downturn, the most reliable strategy is simply to stay the course and continue allocating capital to the S&P 500. Investors can easily do this through an S&P 500-themed ETF.
The index provides built-in diversification across blue chip industry leaders, high-growth innovators, and steady dividend payers across every major sector. This breadth cushions the impact of any single industry's weakness while ensuring upside participation in the eventual rebound.
This analysis shows that stocks ultimately rise after market crashes and recessions. Attempting to time your exits and reentry points ultimately risks missing the recovery phase. By remaining invested through volatility, smart investors effectively purchase stocks at more attractive valuations and build positions in their portfolio that capture the full arc of the next major expansion.
Should you buy stock in S&P 500 Index right now?
Before you buy stock in S&P 500 Index, consider this:
The Motley Fool Stock Advisor analyst team just identified what they believe are the 10 best stocks for investors to buy now… and S&P 500 Index wasn’t one of them. The 10 stocks that made the cut could produce monster returns in the coming years.
Consider when Netflix made this list on December 17, 2004... if you invested $1,000 at the time of our recommendation, you’d have $399,832!* Or when Nvidia made this list on April 15, 2005... if you invested $1,000 at the time of our recommendation, you’d have $1,374,595!*
Now, it’s worth noting Stock Advisor’s total average return is 968% — a market-crushing outperformance compared to 215% for the S&P 500. Don't miss the latest top 10 list, available with Stock Advisor, and join an investing community built by individual investors for individual investors.
See the 10 stocks »
*Stock Advisor returns as of August 9, 2026.
Adam Spatacco has no position in any of the stocks mentioned. The Motley Fool has no position in any of the stocks mentioned. The Motley Fool has a disclosure policy.
Recommended Articles


