

The Stock Market Is on the Verge of Doing Something for the First Time in 155 Years, and History Is Crystal Clear on What It Could Mean for Investors
Key Points
The Shiller CAPE ratio measures whether the S&P 500 is over- or undervalued.
During prior market cycles, a rising CAPE ratio was usually indicative of a market downturn.
With the CAPE ratio inching closer to historical thresholds, the S&P 500 appears increasingly vulnerable to a sell-off.
- 10 stocks we like better than S&P 500 Index ›
If you regularly tune in to financial news programming, you're probably familiar with Wall Street analysts citing the price-to-earnings ratio (P/E) -- either looking back over the previous 12 months or looking at earnings estimates for the next 12 -- as a common way to value the S&P 500 (SNPINDEX: ^GSPC).
While these metrics are useful, I think the cyclically adjusted price-to-earnings (CAPE) ratio stands as one of the more insightful tools for assessing long-term stock market valuations. The CAPE ratio was developed to smooth out the volatility seen in single-year earnings figures. It's calculated by taking the current price of the stock market relative to the average of earnings per share (EPS) over the prior 10 years. This approach better reveals whether stocks are trading at levels justified by companies' financial performance, or if speculation has fueled prices to unsustainable extremes.
Missed Nvidia in 2009? This Rare Signal Is Flashing Again. In 2009, a "Double Down" signal flashed for a little-known chipmaker called Nvidia. For the first time in years, that same "Total Conviction" signal is flashing for a company 1/100th the size of Nvidia. Continue »
Overall, the CAPE ratio has been useful in highlighting cycles of overvaluation and undervaluation, helping shape investor outcomes along the way. At recent prices, the CAPE ratio sat at a reading of 41 -- firmly in overvaluation territory. Let's break down what this could signal and what warrants careful consideration.
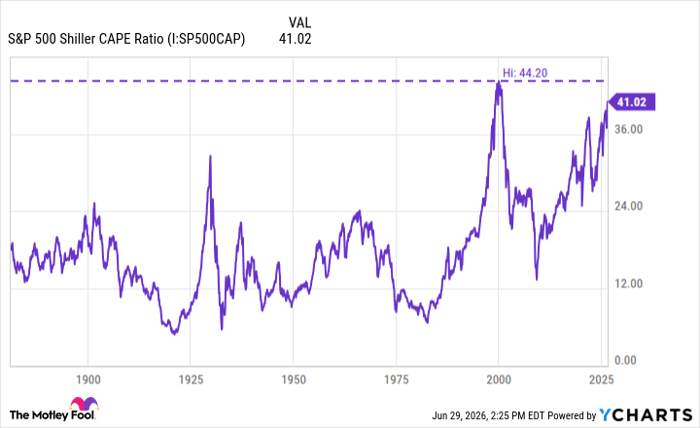
S&P 500 Shiller CAPE Ratio data by YCharts.
What does the CAPE ratio measure, and why does it matter?
The CAPE ratio improves upon traditional valuation measures because it incorporates a decade of inflation-adjusted earnings data. By doing so, the CAPE ratio mitigates abnormalities from business cycle peaks and troughs, such as recessions, which often temporarily depress earnings, or booms, which inflate them.
As a result, the CAPE ratio provides a reliable gauge of whether the broader market is cheap or frothy relative to historical benchmarks. Moreover, its importance lies in its track record as a barometer of long-term returns. Long-term analysis of the CAPE ratio has uncovered that elevated readings, like those seen now, tend to precede prolonged periods of below-average market returns.

Image source: Getty Images.
When has the CAPE ratio peaked in the past?
Broadly speaking, elevated CAPE ratios typically indicate that stock prices are decoupling from sustainable earnings growth. This is often propelled by a combination of technological or economic narratives, abundant liquidity, and widespread enthusiasm.
During the 1920s, the CAPE ratio climbed steadily -- ultimately reaching a reading of 27.6 in 1929 amid rapid industrialization and easy credit. This environment fueled a speculative bubble that eventually burst and triggered the Great Depression. The Dow Jones Industrial Average (DJINDICES: ^DJI) lost nearly 90% of its value from peak to trough over the next four years.
In more recent history, the late 1990s and early 2000s witnessed more extreme readings, with the CAPE ratio peaking around 44 between 1999 and 2000. This time, the surge was driven by the dot-com revolution, when investors poured unprecedented capital into internet-related companies promising transformative growth, despite many lacking real business models or tangible earnings power.
When expectations proved overly optimistic, the dot-com bubble deflated sharply, resulting in a prolonged period of sideways trading and significant wealth destruction.
Will the stock market crash in 2026?
Since 2020, the CAPE ratio has clocked an average reading of around 30 or more on an annual basis. According to 155 years of tested market data, today's CAPE ratio levels are within striking distance of eclipsing the peaks that were witnessed over two decades ago.
While past performance is never a guaranteed indicator of future results, it's hard to dismiss the patterns here. A rising CAPE ratio suggests that elevated valuations come with a heightened vulnerability to corrections or sharp drawdowns should growth expectations disappoint or external macro pressures mount.
To prepare for potential market turbulence, the most effective hedging strategy revolves around thoughtful portfolio construction executed before any sell-offs begin. Broad diversification across asset classes is essential. This includes allocations to government-issued bonds, which typically rally when stocks falter due to safe-haven demand. Incorporating commodities such as gold can add further insulation against geopolitical or inflationary shocks.
In addition, building a cash buffer provides flexibility to deploy capital at more attractive valuations during dips. Within stocks, shifting emphasis toward defensive industries such as consumer staples also reduces overall sensitivity to higher-growth sectors.
By maintaining a cautious outlook around valuation and avoiding heavy concentration in the most expensive and volatile pockets of the stock market, portfolios can be positioned to endure unpredictability while remaining aligned with the long-term objective of building and maintaining wealth.
Should you buy stock in S&P 500 Index right now?
Before you buy stock in S&P 500 Index, consider this:
The Motley Fool Stock Advisor analyst team just identified what they believe are the 10 best stocks for investors to buy now… and S&P 500 Index wasn’t one of them. The 10 stocks that made the cut could produce monster returns in the coming years.
Consider when Netflix made this list on December 17, 2004... if you invested $1,000 at the time of our recommendation, you’d have $385,055!* Or when Nvidia made this list on April 15, 2005... if you invested $1,000 at the time of our recommendation, you’d have $1,228,089!*
Now, it’s worth noting Stock Advisor’s total average return is 902% — a market-crushing outperformance compared to 209% for the S&P 500. Don't miss the latest top 10 list, available with Stock Advisor, and join an investing community built by individual investors for individual investors.
See the 10 stocks »
*Stock Advisor returns as of July 2, 2026.
Adam Spatacco has no position in any of the stocks mentioned. The Motley Fool has no position in any of the stocks mentioned. The Motley Fool has a disclosure policy.
Recommended Articles


