

Gold Price Forecast: Does Gold Falling Below $4,000 Mean the Bull Market Is Over? Will It Still Rise in the Second Half of 2026?

- Gold Price Forecast: PCE Data Weakens Fed Rate Hike Expectations, Can Gold Price Hold Steady at $4,000?
- $4,050: Gold dives to fresh two-week low as Fed rate hike bets boost US Dollar
- Gold Price Forecast: Gold Price Falls Below $4,000, PCE Data May Push Gold Down to $3,900
- Gold Price Trend Forecast: Gold Price Risks Falling Below $4,000, PCE Data Is Key
- Deutsche Bank Slashes Gold Price Forecast by 22%: Wall Street Bulls Retreat, Fed Rate Hike Expectations Become Biggest Drag
- Qatar and Pakistan: High-level committee agrees on roadmap to final deal within 60 days
TradingKey - Heading into the second half of 2026, the gold market has transitioned from a strong-performing asset at the start of the year into one pulling back from its highs. Recently, gold prices fell below the $4,000 threshold for the first time since November 2025, down about 29% from the record high of $5,597.91 established in January. On the surface, gold appears to have entered a distinct period of weakness. However, looking at the year as a whole, can gold still rise in 2026? The answer is that while short-term pressure remains, there are still opportunities for a medium-term recovery, and the long-term bullish thesis has not been fully dismantled.
Gold under short-term pressure
From a fundamental perspective, the core factor weighing on gold in the short term is the significant rise in Federal Reserve rate hike expectations. Previously, a key driver for gold's rally was the market expectation that the Fed would enter a rate-cut cycle, as falling real interest rates would reduce the opportunity cost of holding gold. However, the situation has reversed. With U.S. inflation remaining stubborn, the market has begun to bet again that the Fed could raise rates this year. According to Reuters, traders currently expect up to three rate hikes this year, with the probability of a September hike at approximately 67%. Against this backdrop, the U.S. dollar has remained near a 13-month high, naturally dampening the appeal of gold as a non-yielding asset.
Therefore, for gold to stage a short-term rebound, interest rate expectations must first cool. If upcoming U.S. PCE, employment, and consumption data show a pullback in inflationary pressures, thereby dampening Fed rate hike expectations and driving down the U.S. dollar and Treasury yields, only then will gold have a chance to rebound from around $4,000. Conversely, if inflation data continues to run hot, prompting the market to further price in a rate hike in September or even earlier, gold could continue to head toward $3,900 or even lower to find support.
The long-term bullish thesis continues to provide support for gold prices.
However, a short-term pullback does not mean that the bullish thesis for gold in 2026 has completely broken down. Gold still has two key pillars of support in the medium to long term: central bank gold purchases, and safe-haven and de-dollarization demand within global asset allocation. According to data from the World Gold Council, global central banks net purchased 244 tons of gold in the first quarter of 2026, a 3% year-on-year increase. Its outlook also noted that geopolitical factors will remain a key driver of gold demand in 2026, supporting central bank buying, ETF inflows, and demand for gold bars and coins. This suggests that gold is by no means completely devoid of buying interest on the downside.
Unlike equities, long-term demand for gold does not come solely from trading capital, but also from central bank reserve allocations, sovereign risk hedging, and retail demand for wealth preservation. Even if the Federal Reserve leans hawkish in the short term, as long as global geopolitical risks, fiscal deficits, and concerns over currency credibility persist, it will be difficult for gold to revert entirely to the pricing dynamics of a typical commodity.
Institutional views also show a divergence, with short-term caution contrasting with long-term bullishness. ING has already revised down its gold forecasts, expecting the average price of gold to be $4,300 per ounce in the third quarter of 2026 and $4,600 in the fourth quarter—lower than previously expected, indicating that some institutions acknowledge a strong dollar and high interest rates will damp gold's upward momentum. However, JPMorgan still believes that gold's long-term trend has not run its course, expecting gold prices to approach $5,000 in the fourth quarter of 2026, with the potential to challenge $6,000 over the long term, on the grounds that allocation demand from central banks and investors remains strong.
Furthermore, it is worth noting that ETF flows are a key intermediate variable for judging whether gold can regain its upward momentum. Data from the World Gold Council shows that global gold ETF inflows slowed significantly in May, with assets under management declining 2% month-on-month and holdings falling to 4,121 tons. Reuters pointed out that if expectations of Fed rate hikes continue to rise, gold ETFs could face renewed outflow pressure. For gold, central bank purchases act more like a long-term core holding, whereas ETF flows are the ammunition that drives a rapid rally. If ETF flows do not return, any rebound in gold is more likely to be a corrective bounce rather than an immediate resumption of its main upward trend.
Gold Price Technical Analysis: Gold's Monthly Bullish Trend Remains Intact
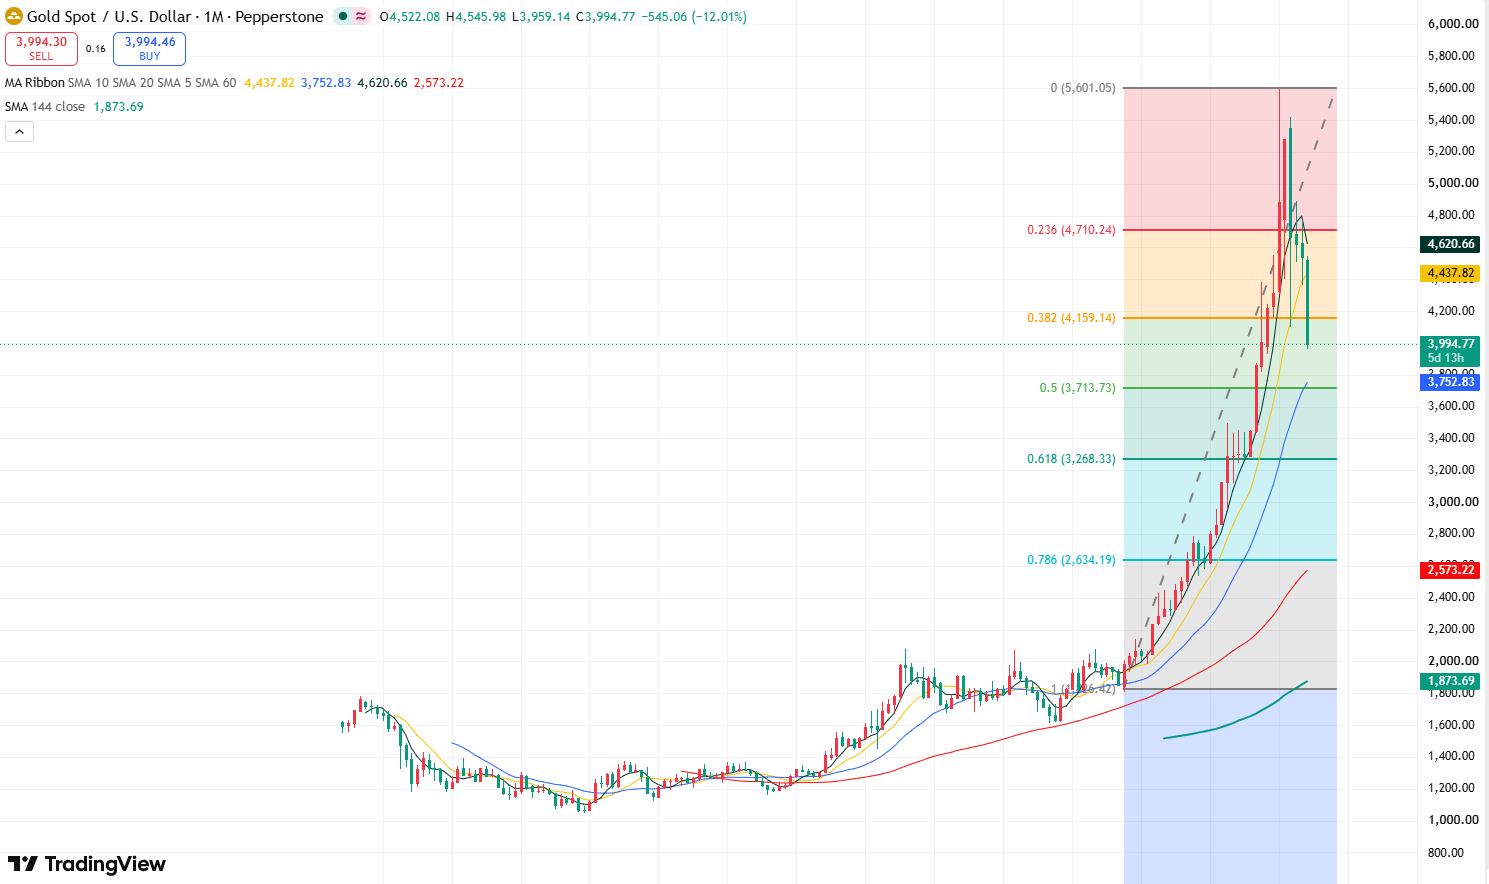
Gold price monthly chart, Source: TradingView
Looking at gold's monthly chart, the price has pulled back for the fourth consecutive month, breaking below the psychological level of $4,000, which indicates that near-term market sentiment leans bearish. However, it is worth noting that the moving average system shows multiple moving averages still maintaining a bullish alignment, suggesting that gold's long-term bullish trend remains intact.
Currently, the primary immediate support level below for gold is around the 0.5 Fibonacci retracement level near $3,700. As this area also aligns with the SME20, it forms a confluence of support; if gold prices continue to slide toward this level, they may find strong support, where bulls can attempt to buy the dips.
Read more
* The content presented above, whether from a third party or not, is considered as general advice only. This article should not be construed as containing investment advice, investment recommendations, an offer of or solicitation for any transactions in financial instruments.


