

American Express (AXP) Forms Double Top at $346 — Is a Pullback to $323 Coming?
TradingKey - Shares of American Express (NYSE: AXP) are now at $340.54 after a double top pattern near $346.89 appeared to develop across the daily timeframe, while lower highs alongside distribution candles with long upper wicks above resistance also emerged. The stock's 14-day RSI is at 69.07 and getting close to overbought, and candlestick pattern recognition says it looks like a distribution rather than new accumulation pattern, a combination the chart reads as an early momentum shift after the rally phase. This is after Q1 2026 revenue of $18.9 billion, up 11% or 10% in FX-adjusted terms, earnings per share (EPS) of $4.28, up 18% in year-over-year terms, and a card member net write-off rate of 2.3% in Q1, a level considered to be some of the best credit quality performance the company has ever produced. While the chart shows a mixed picture at the moment, the fundamental picture remains clear, and investors should be working now to reconcile the two.
What Can Lead to a Double Top Developing After Truly Strong Earnings?
It's not atypical to encounter bearish-looking patterns that develop after good news has come out, and some may wonder how can you see both a double top and strong fundamentals simultaneously? The answer is that they don't necessarily have to have any correlation whatsoever. For instance, American Express ran up to its April 23 Q1 report and the Q1 numbers showed EPS that exceeded expectations by 7%, sales exceeding by 1.6%, and guidance being reaffirmed for a full year for a revenue pace of 9 to 10% and $17.30 to $17.90 in earnings per share. Yet shares dipped only slightly in pre-market trade right after the report came out, suggesting the market had already priced in the good news going into the results print. What's more, seeing a double top near $346.89 form two months after a quarter where the company had exceeded expectations and reaffirmed its guidance for its full year could have more to do with valuation and overall sentiment rather than showing that card member usage or credit quality has changed.
One figure that should be enough to prove this is not the beginning of a fundamental breakdown: A net write-off rate of 2.3% in Q1 is quite strong for a card issuer in almost any type of environment, and management has previously described its credit performance as best-in-class and reflective of its track record of several years. If this were about a fundamental breakdown in the stock, something that should have a long-lasting impact on the stock price irrespective of sentiment, one might expect to see it first in the card member write-off rate.
While American Express’s main defense, its base of upper-middle class or better cardholders, is holding up so far, it’s not immune to a recession or a significant downturn in the stock market. Card member spend grew 10% last quarter to 9% in FX-adjusted terms, with billed business rising to $428.0 billion from $387.4 billion in the same period a year ago. That growth rate is notable given April’s CPI print of 3.8% and 4.1% for core, a period under a cautious Warsh Fed. With a 10% growth rate under such conditions, it seems evident that affluent consumer spending is holding well, as the rest of the consumer market is starting to show signs of weakness. International Card Services and Global Merchant Services add even more revenue growth diversity to the AXP portfolio that is not solely dependent on the U.S. premium consumer.
However, while American Express’s affluent consumer base is an important factor that’s been helpful so far, it’s certainly not a hedge against a material recession or equity-market-driven decline in the net worth of Amex’s top-tier consumer cardholders. Also notable is that management is choosing to spend more on marketing and technology off a particularly strong quarter, instead of bank the surplus for additional margin, as management indicated confidence in the medium-term trajectory. But that also means expenses are rising alongside revenue growth, so there is less of a cushion if billed business starts to decelerate from the current 10% level. The downside to AXP is not a material weakness, but that the current bullish thesis may already be priced into the rally into $346.89.
AXP: Double-Top at $346.89, RSI 69.07 and $323.40 Target
The daily-time frame on AXP recently formed a double top near $346.89 and is characterized by a series of lower highs and distribution candles, with some having notably elongated upper wicks. That confirms that seller pressure is building up at the resistance level and the price is having trouble pushing higher.
Additionally, with the RSI at 69.07, it’s approaching overbought, and this combination of an elevated RSI plus clear distribution at the pattern’s neckline makes for an archetypal double-top set up. The next level of support from this current swing high is the Fibonacci level at 0.236 or $335.81 and the 0.382 retracement level at $328.96. Deeper levels exist at the 0.5 retracement level at $323.42 and the 0.618 level at $317.88.
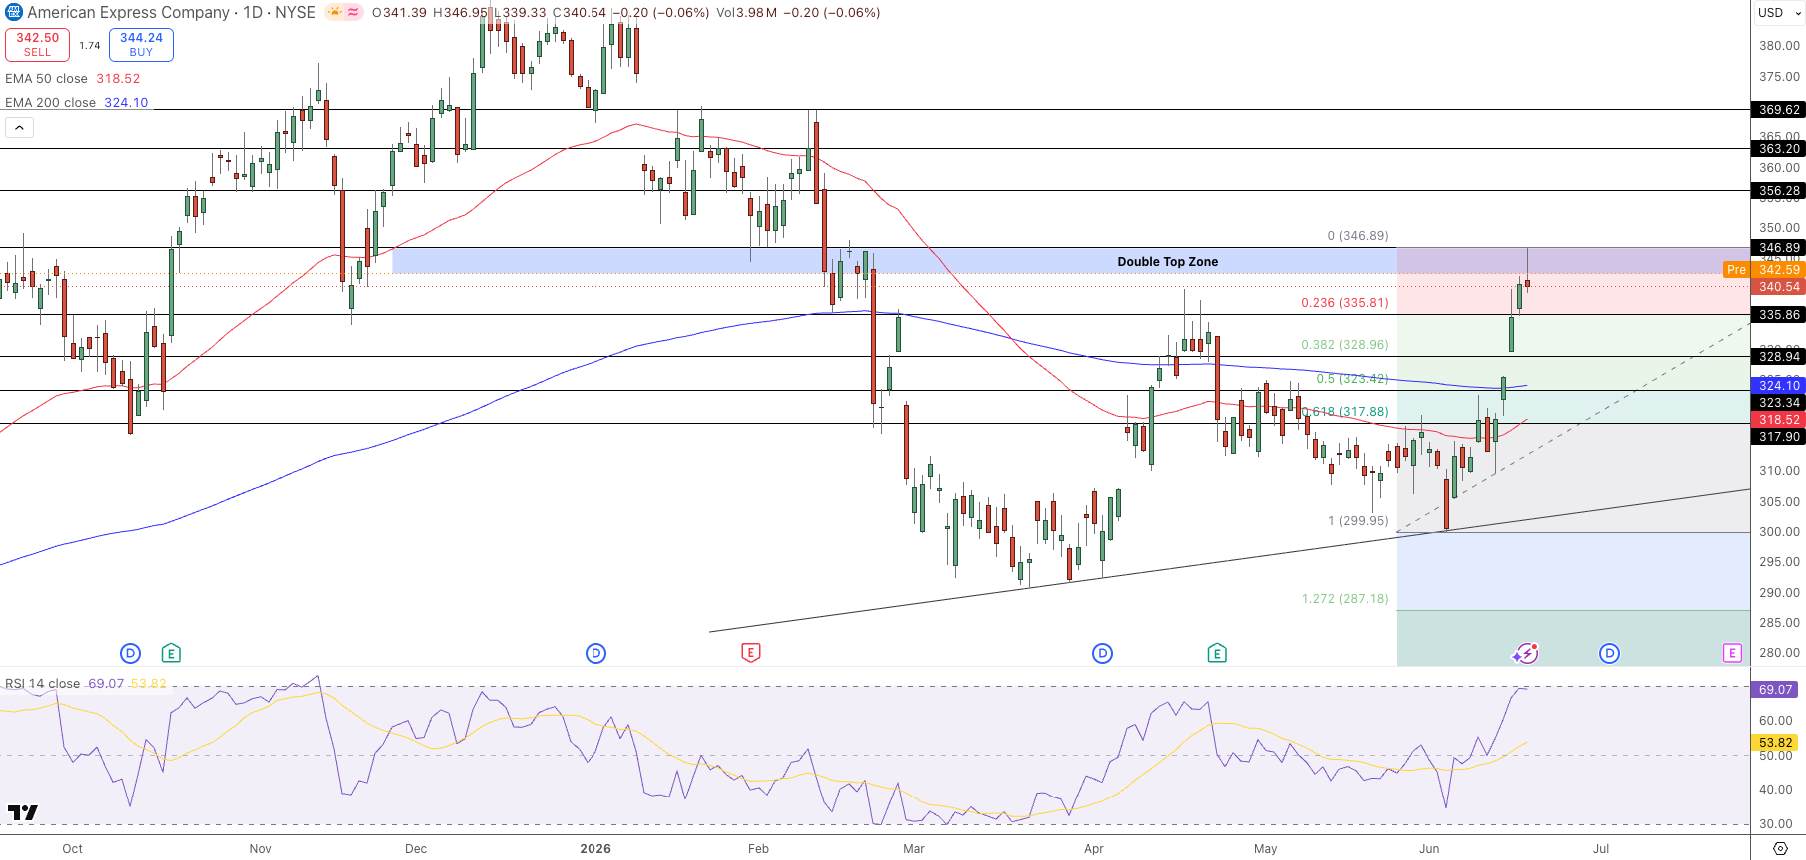
American Express Price Chart - Source: Tradingview
A breakdown below $335.80, which is the pattern’s neckline level, sets a path toward $323.40, the 0.5 retracement level. In the event of the pattern’s full projection, a double-top breakdown targets $299 to $287, and AXP would have to reclaim above $346.90 to invalidate the bearish formation and put the prior high back in play.
- Short on daily close below $335.80: the pattern’s neckline.
- Target $323.40: the 0.5 Fib retracement level.
- Extensions to $299 to $287: the pattern’s full projection.
- Stop loss on daily close above $346.90: when the bearish pattern is invalidated and the pattern is invalidated by a reclaim of the prior high.
What Did American Express Report in Q1 2026?
American Express posted Q1 2026 revenue at $18.9 billion, representing an 11% increase (10% when adjusted for foreign exchange), alongside diluted EPS of $4.28, an 18% rise from the year prior, topping the $4.00 consensus by a margin of 7%. Net income was noted at $2.97 billion, climbing 15% on a year-over-year basis. Card member spend growth improved to 10% (9% FX-adjusted), with billed business at $428.0 billion. A net write-off rate of 2.3%, one of the most favorable credit metrics the company has posted in recent memory, was reported. The firm maintained its full-year 2026 outlook, projecting 9% to 10% revenue growth and EPS of $17.30 to $17.90.
Does the Double Top Pattern Mean American Express’s Fundamentals Are Weakening?
Based on the data available at present, the answer is no. The 2.3% net write-off ratio and improved card member spend growth are both indications against the business fundamentals weakening. The double top pattern typically materializes following a stock’s substantial gains on the back of strong results, only to fall back (mean-revert) due to valuation concerns or broader macro sentiment instead of signaling a shift in quality of the underlying business. Indeed, AXP shares actually fell modestly in the first few minutes after the Q1 beat in April, indicating that a large portion of the positive news had already been discounted before the stock’s upward move to the $346.89 peak that became the second top.
Should Investors Short AXP at the Double Top, or Is This a Buying Opportunity on Weakness?
For short-term traders, a technical short would be triggered with a break of the $335.80 support, aiming for a price target of $323.40, with a potential downside to $299 and $287 in the case of a breakdown below these levels, and a risk management stop placed above $346.90. From a fundamental standpoint, though, the business remains robust, with revenue growth of 11%, EPS of 18%, and net write-offs of 2.3%, which remains best-in-class. This could entice a value-seeking long position should AXP’s price drop into the $317 to $323 area.
Whether you short the breakout or buy the dip depends on your time frame. In the short term, you can simply track the pattern, but for long-term investors, an opportunity may present itself if the stock falls toward the lower Fibonacci levels of the pattern as a chance to enter a fundamentally solid premium company.
Bottom Line
American Express’s $346.89 double top is a technical pattern built on top of some truly strong fundamentals: an 11% revenue increase, an 18% increase in EPS, and a 2.3% net write-off rate that was among the best the company has posted in recent times. While the stock chart indicates a stock that got ahead of itself and is now falling back, the company’s business does not suggest any sort of deterioration in either credit or customer spend that would typically accompany such a move. The $335.80 support level, if breached, would send the price target to $323.40, with a $299 to $287 downside if the move deepens.
Meanwhile, if the $346.90 resistance is reclaimed and the $346.90 level is turned into the floor, the technical double top would be nullified. Either way, there’s a limit to the cushion a premium cardholder base could provide. The Q2 earnings report is poised to settle this debate.
Recommended Articles


