

Bitcoin Price Forecast: BTC slips below $64,000 as hawkish Fed stance weighs on risk appetite

- Trump's Account May Contain BTC. US President Proposes Another Bitcoin Policy, Just Another Political Talk Show?
- Gold declines as Trump scraps Iran memorandum, markets await Fed minutes
- US President Trump: I think MoU with Iran is over
- Gold Price Forecast: XAU/USD struggles to extend recovery above 20-day EMA
- WTI Crude Oil Price Forecast: US-Iran Conflict Reignites, Will a New Round of Oil Price Rises Begin?
- TradingKey Daily Market Briefing: OPEC+ Continues Output Boost, Oil Prices Under Pressure, Gold Rebounds, Bitcoin Stands Above $63,000

Bitcoin slips below $64,000 on Thursday, extending its losses so far this week.
Fed held interest rates steady, but the hawkish forward projection dampens risk appetite, weighing on risk assets.
Mixed sentiment, with a slight bearish tilt, among institutional investors caps BTC.
Bitcoin (BTC) remains under pressure, extending its correction, trading below $64,000 at the time of writing on Thursday. The US Federal Reserve (Fed) left interest rates unchanged but struck a hawkish tone on Wednesday, dampening the risk sentiment. Meanwhile, mixed flows from institutional demand, with a slight bearish tilt, capped the Crypto King’s upside.
Fed hawkish forward projection dampens risk appetite
The US Fed announced the interest rate decision late Wednesday. The US central bank, as widely expected, kept its benchmark interest rate unchanged at a target range of 3.50% to 3.75% in what was Kevin Warsh's first meeting as Fed Chair.
Traders were especially focused this time on the central bank’s forward guidance and on Kevin Warsh’s words. The Fed eliminated the language indicating a bias toward further easing, with the rate-setting committee sending a clear message that it supported higher rates. In fact, policymakers estimated the Fed funds rate at 3.8% by the end of this year, up from 3.4% projected in March.
Traders were quick to react to the banks hawkish guidance and are now pricing in nearly an 85% chance of a rate hike in December. The shift in expectations pushed US Treasury yields and the US Dollar higher, reducing the appetite for risk assets. As a result, Bitcoin came under renewed selling pressure, trading below $64,000 on Thursday as investors trimmed exposure to risk-sensitive assets.
Institutional investors remain cautious
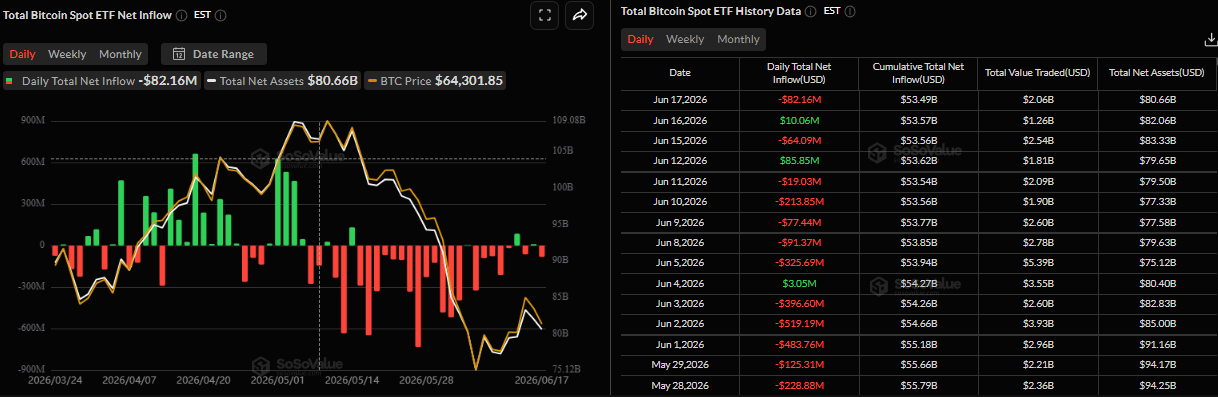
SoSoValue data showed that spot Bitcoin Exchange Traded Funds (ETFs) recorded an outflow of $82.16 million on Wednesday, following an inflow of $10.06 million on Tuesday and an outflow of $64.05 million on Monday. These mixed flows, with a slight bearish tilt, keep a lid on BTC upside and signal cautious investor sentiment. If ETF outflows continue and intensify throughout the week, BTC could see further price declines.
Signs of concern
As explained in the previous report, BTC staged a tentative relief bounce last week from deeply oversold levels, and current market conditions suggest stabilization rather than a trend reversal.
In addition, the rebound appears to have been driven largely by seller exhaustion rather than a meaningful recovery in investor demand, suggesting the rally may lack a solid foundation.
Unless fresh buying interest emerges, BTC could extend its ongoing correction toward $53,600, a level that has historically marked bear-market bottoms in previous cycles.
Bitcoin Price Forecast: BTC extends losses
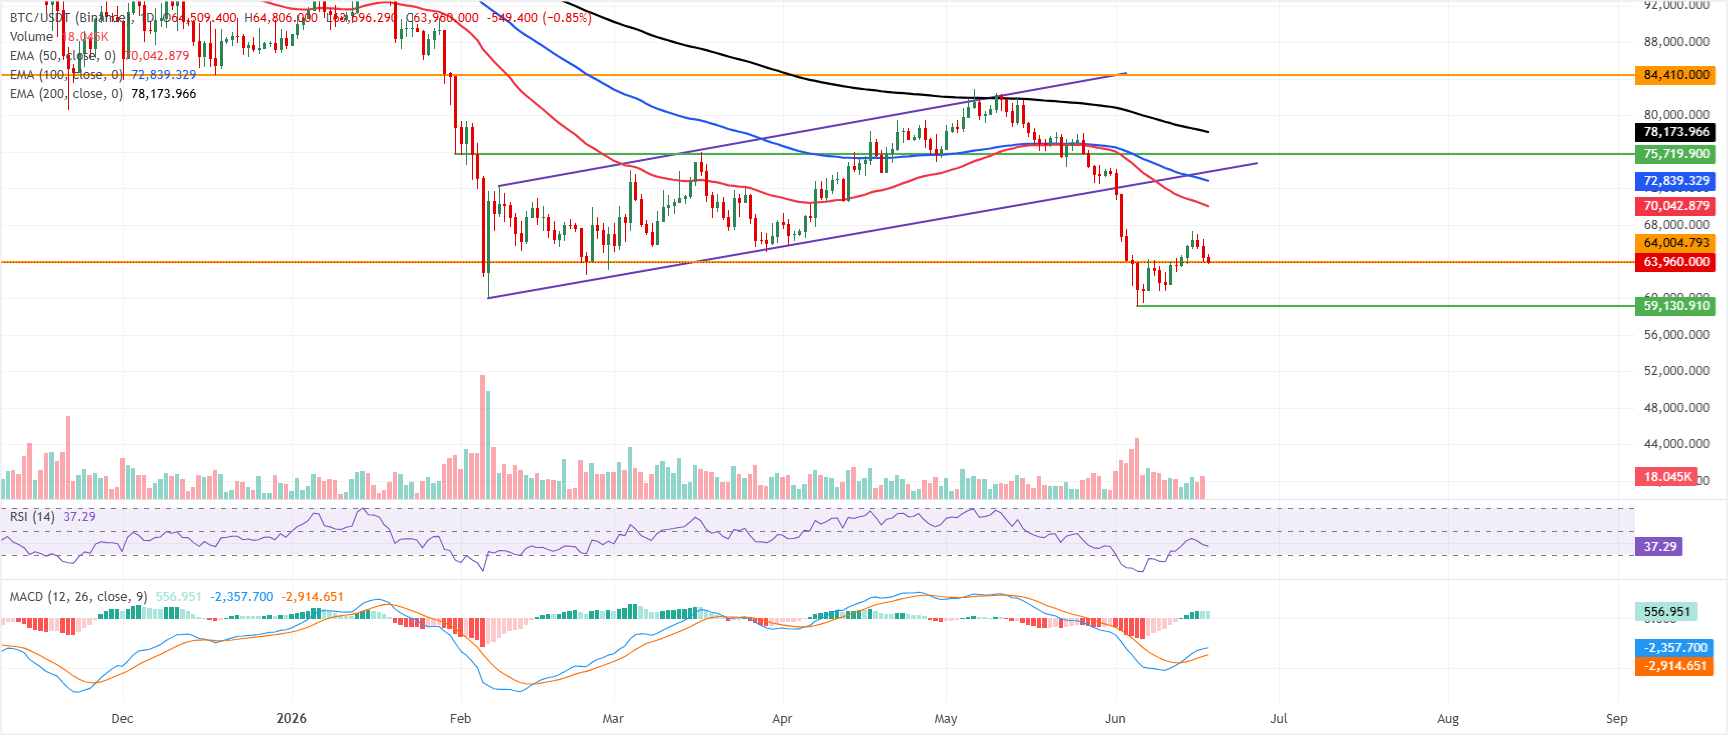
Bitcoin price trades below $64,000 on Thursday, extending its ongoing losses. BTC is maintaining a bearish near-term tone and remains below the 50-day, 100-day, and 200-day Exponential Moving Averages (EMAs).
The failed uptrend support, now coming in well above price near $73,833, reinforces a market capped by overhead supply. The Relative Strength Index (RSI) on the daily chart hovers in the high-30s, hinting at persistent but not yet extreme bearish momentum. At the same time, the Moving Average Convergence Divergence (MACD) histogram remains in positive territory, suggesting that any rebounds are still corrective within a broader downside-biased structure.
On the topside, initial resistance emerges near the horizontal barrier around $64,004, with stronger supply then seen at the 50-day EMA near $70,042 and the 100-day EMA around $72,839. Above that, the reclaimed bear area, defined by the broken trendline zone around $73,833, precedes the longer-term cap at the 200-day EMA near $78,174, with the horizontal high near $84,410 serving as a distant bullish validation level.
With no clear nearby structural supports below the spot in this dataset, downside risks remain open, and traders may look for fresh price action to carve out a new floor before anticipating a more durable recovery.
(The technical analysis of this story was written with the help of an AI tool.)
Read more
* The content presented above, whether from a third party or not, is considered as general advice only. This article should not be construed as containing investment advice, investment recommendations, an offer of or solicitation for any transactions in financial instruments.


