

VTI vs VOO: Which One Is the Smarter Buy Today?
Key Points
The Vanguard S&P 500 ETF (VOO) covers the U.S. large-cap market, while the Vanguard Total Stock Market ETF (VTI) includes virtually every investable stock.
VTI's inclusion of mid- and small-cap stocks is the big differentiator, and it's weighed down performance over the past decade.
That trend is set to reverse thanks to a small-cap earnings growth acceleration.
- 10 stocks we like better than Vanguard Total Stock Market ETF ›
The Vanguard S&P 500 ETF (NYSEMKT: VOO) and the Vanguard Total Stock Market ETF (NYSEMKT: VTI) are two of the most well-known and widely invested funds in the world. With combined assets of more than $1.6 trillion, they serve as the cornerstone of countless portfolios.
But the two exchange-traded funds (ETFs) are not the same. Both offer market-cap weighted baskets of U.S. stocks, making them look and act very similar. But the latter's inclusion of mid- and small-cap stocks could be the differentiator that makes it the better opportunity at the moment.
Will AI create the world's first trillionaire? Our team just released a report on the one little-known company, called an "Indispensable Monopoly" providing the critical technology Nvidia and Intel both need. Continue »

Image source: Getty Images.
VTI and VOO are built differently
The Vanguard S&P 500 ETF tracks the S&P 500, a basket of 500 of the largest U.S. stocks. The Vanguard Total Stock Market ETF follows the CRSP U.S. Total Market Index. Its aim is to include virtually every investable U.S. stock there is. It includes nearly 3,500 companies across all market caps.
| Metric | VTI | VOO |
|---|---|---|
| Index it mirrors | CRSP U.S. Total Market Index | S&P 500 |
| Holdings | 3,494 | 505 |
| Expense ratio | 0.03% | 0.03% |
| 10-year annualized return | 15.3% | 15.8% |
| Dividend yield | 1.1% | 1.1% |
| Top sectors | Tech (39%) Consumer Discretionary (13%) Industrials (12%) |
Tech (35%) |
| Top holdings | Nvidia (7.9%) Apple (6.5%) Microsoft (4.9%) |
Nvidia (6.6%) Apple (5.7%) Microsoft (4.4%) |
Data source: Vanguard.
Currently, there's about 88% overlap of holdings, which is obviously why the two funds perform so similarly. But the 10-year average annual return shows how smaller stocks have been a drag on performance for a while. Which of the two ETFs will excel going forward depends almost entirely on whether small caps can outperform large caps.
Why the current environment favors VTI
U.S. stock market performance this year, especially in the tech sector, has been driven by strong earnings growth. Years of hype have finally translated into rapid revenue and earnings growth. Not only has that led to solid returns for investors, but it has also meant that valuations have actually been shrinking. Concerns about stock valuations being expensive haven't entirely gone away, but they've been mitigated over the past couple of quarters.
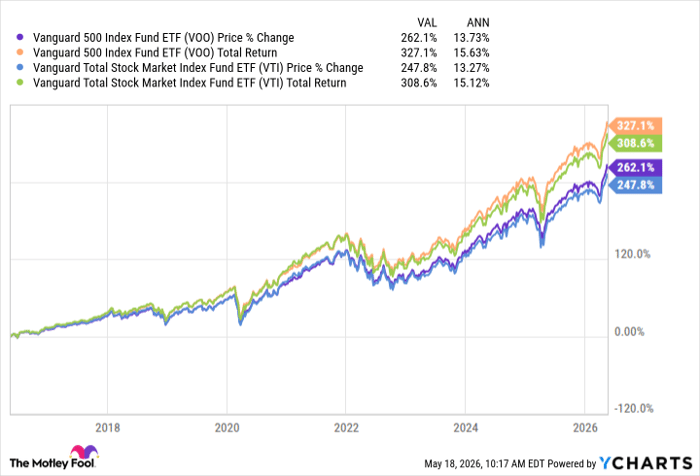
Data by YCharts.
What makes the case for small caps (and by extension the Vanguard Total Stock Market ETF) over the next couple of years is that they're expected to finally participate in the earnings growth expansion. In 2026, small caps are forecast to see stronger earnings growth than the S&P 500 for the first time in years.
Considering that the Vanguard S&P 500 ETF trades at a price-to-earnings (P/E) ratio of 27 and the Vanguard S&P Small-Cap 600 ETF (NYSEMKT: VIOO) trades at just 18 times earnings, that provides a strong opportunity for small-cap performance to match or exceed the performance of large caps in the coming years.
The case for small caps makes the case for the Vanguard Total Stock Market ETF. If this performance catch-up ultimately happens, this ETF becomes the better play.
Should you buy stock in Vanguard Total Stock Market ETF right now?
Before you buy stock in Vanguard Total Stock Market ETF, consider this:
The Motley Fool Stock Advisor analyst team just identified what they believe are the 10 best stocks for investors to buy now… and Vanguard Total Stock Market ETF wasn’t one of them. The 10 stocks that made the cut could produce monster returns in the coming years.
Consider when Netflix made this list on December 17, 2004... if you invested $1,000 at the time of our recommendation, you’d have $469,293!* Or when Nvidia made this list on April 15, 2005... if you invested $1,000 at the time of our recommendation, you’d have $1,381,332!*
Now, it’s worth noting Stock Advisor’s total average return is 993% — a market-crushing outperformance compared to 207% for the S&P 500. Don't miss the latest top 10 list, available with Stock Advisor, and join an investing community built by individual investors for individual investors.
See the 10 stocks »
*Stock Advisor returns as of May 19, 2026.
David Dierking has positions in Vanguard Total Stock Market ETF. The Motley Fool has positions in and recommends Vanguard S&P 500 ETF. The Motley Fool has a disclosure policy.
Recommended Articles


