

Trump threatens heavy Iran strikes as Tehran defies pressure
US President Donald Trump said that the US “will be attacking Iran very hard,” as he pressures Tehran to sign the deal, adding that “they’ve taken too long to negotiate a deal that would have been great for them, now they will have to pay the price.”
Iran’s President Masoud Pezeshkian posted on X his response to Trump’s threat to attack infrastructure, “Critical infrastructure is the lifeblood of the people. Threatening to target them, from transportation networks to electricity and water utilities, is not a show of strength but a sign of desperation in the face of a nation's will. Iran will remain steadfast against any pressure and threat, relying on the knowledge and ability of experts, national unity, and solidarity.”
Market’s reaction
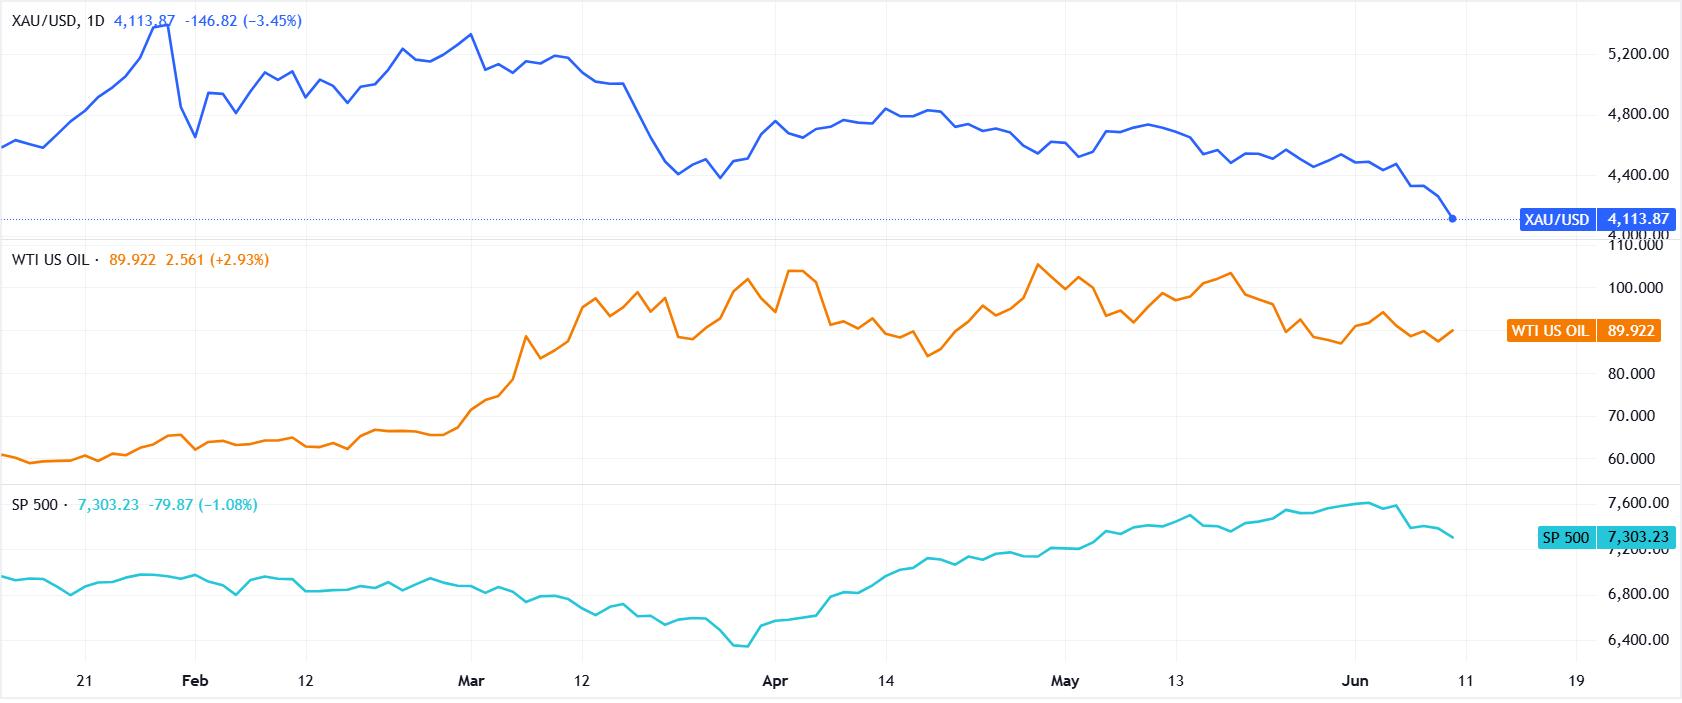
- Gold is down almost 3.50% to $4,116, while the US Dollar Index (DXY) is about to turn flat at 99.97.
- The US crude Oil benchmark WTI pared earlier losses, gaining over 2.80% as of writing, with the price per barrel back above $91.00.
- US equities are also down, with the S&P 500 and the Nasdaq down over 1% and 1.6%, respectively.
Gold vs. Oil vs. S&P 500
US Dollar Price Today
The table below shows the percentage change of US Dollar (USD) against listed major currencies today. US Dollar was the strongest against the Australian Dollar.
| USD | EUR | GBP | JPY | CAD | AUD | NZD | CHF | |
|---|---|---|---|---|---|---|---|---|
| USD | -0.06% | -0.03% | 0.08% | -0.13% | 0.20% | 0.02% | 0.09% | |
| EUR | 0.06% | 0.01% | 0.15% | -0.10% | 0.19% | 0.09% | 0.15% | |
| GBP | 0.03% | -0.01% | 0.13% | -0.09% | 0.20% | 0.08% | 0.13% | |
| JPY | -0.08% | -0.15% | -0.13% | -0.21% | 0.08% | -0.06% | -0.01% | |
| CAD | 0.13% | 0.10% | 0.09% | 0.21% | 0.30% | 0.16% | 0.20% | |
| AUD | -0.20% | -0.19% | -0.20% | -0.08% | -0.30% | -0.13% | -0.08% | |
| NZD | -0.02% | -0.09% | -0.08% | 0.06% | -0.16% | 0.13% | 0.05% | |
| CHF | -0.09% | -0.15% | -0.13% | 0.01% | -0.20% | 0.08% | -0.05% |
The heat map shows percentage changes of major currencies against each other. The base currency is picked from the left column, while the quote currency is picked from the top row. For example, if you pick the US Dollar from the left column and move along the horizontal line to the Japanese Yen, the percentage change displayed in the box will represent USD (base)/JPY (quote).
Risk sentiment FAQs
In the world of financial jargon the two widely used terms “risk-on” and “risk off'' refer to the level of risk that investors are willing to stomach during the period referenced. In a “risk-on” market, investors are optimistic about the future and more willing to buy risky assets. In a “risk-off” market investors start to ‘play it safe’ because they are worried about the future, and therefore buy less risky assets that are more certain of bringing a return, even if it is relatively modest.
Typically, during periods of “risk-on”, stock markets will rise, most commodities – except Gold – will also gain in value, since they benefit from a positive growth outlook. The currencies of nations that are heavy commodity exporters strengthen because of increased demand, and Cryptocurrencies rise. In a “risk-off” market, Bonds go up – especially major government Bonds – Gold shines, and safe-haven currencies such as the Japanese Yen, Swiss Franc and US Dollar all benefit.
The Australian Dollar (AUD), the Canadian Dollar (CAD), the New Zealand Dollar (NZD) and minor FX like the Ruble (RUB) and the South African Rand (ZAR), all tend to rise in markets that are “risk-on”. This is because the economies of these currencies are heavily reliant on commodity exports for growth, and commodities tend to rise in price during risk-on periods. This is because investors foresee greater demand for raw materials in the future due to heightened economic activity.
The major currencies that tend to rise during periods of “risk-off” are the US Dollar (USD), the Japanese Yen (JPY) and the Swiss Franc (CHF). The US Dollar, because it is the world’s reserve currency, and because in times of crisis investors buy US government debt, which is seen as safe because the largest economy in the world is unlikely to default. The Yen, from increased demand for Japanese government bonds, because a high proportion are held by domestic investors who are unlikely to dump them – even in a crisis. The Swiss Franc, because strict Swiss banking laws offer investors enhanced capital protection.
Recommended Articles


