BoE set to leave interest rates unchanged amid increasing expectations of cuts

Source Fxstreet
  • UK central bank is seen keeping its policy rate intact at 5.25%.
  • Bank of England is seen reducing its rates by 75 bps this year.  
  • GBP/USD should maintain its recent familiar range in the wake of the event. 

The Bank of England (BoE) is set to hold its policy rate flat for a sixth meeting in a row on Thursday amid persistent disinflationary pressure in the UK and investors’ repricing of interest rate reductions earlier than anticipated.

Bank of England could lean toward dovish hold

It's anticipated that the Bank of England will maintain the benchmark interest rate at 5.25% after its policy meeting on Thursday at 11:00 GMT. Alongside the policy rate announcement, the bank will release the Monetary Policy Minutes and the Monetary Policy Report, followed by a press conference held by Governor Andrew Bailey.

Although initially anticipated to trail behind the Federal Reserve (Fed) and the European Central Bank (ECB) in initiating their easing measures, the Bank of England (BoE) now appears poised to begin reducing interest rates sooner than expected due to mounting disinflationary pressures.

Furthermore, investors widely anticipate a cut in the Bank of England's interest rates, potentially occurring in August or September, with around a 70% chance of a subsequent decrease in December.

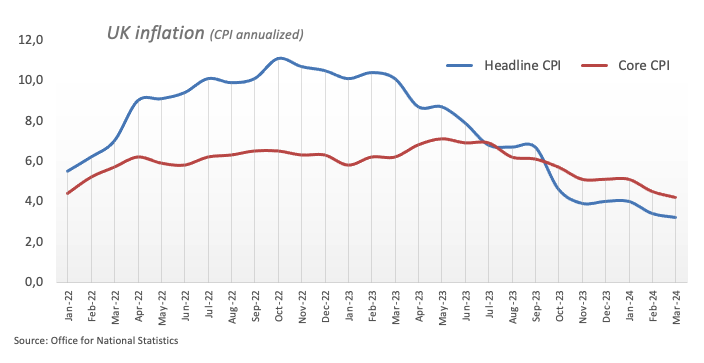
In March, disinflationary trends in the UK accelerated, with the headline Consumer Price Index (CPI) increasing by 3.2% (down from 3.4%) and the core CPI, which excludes food and energy costs, rising by 4.2% (down from 4.5%).

Indeed, the most recent inflation data from the UK seems to challenge the Bank of England's narrative of "higher for longer." Regarding the upcoming event, it is widely expected that the central bank will keep rates unchanged, with the possibility of extending its cautious approach.

During a recent event held by the Institute of International Finance, Governor Andrew Bailey stated that the upcoming inflation figures are anticipated to demonstrate a significant decrease, while he also hinted at some loosening of the labour market.

Back to inflation, the latest BoE’s Decision Maker Panel survey (DMP) conducted between March 8 and 22 showed that one-year ahead CPI inflation expectations decreased to 3.2%, dropping from 3.3% in February. Similarly, three-year-ahead CPI inflation expectations declined to 2.7% over the three months leading to March. Expected year-ahead wage growth, measured on a three-month moving average, also decreased to 4.9%. Consequently, firms anticipate a 1.5 percentage point decrease in their wage growth over the next 12 months based on three-month averages.

At the BoE’s March 21 gathering, Governor Andrew Bailey remarked that it was justifiable for financial markets to anticipate interest rate reductions, expressing optimism regarding the trajectory of inflation. Bailey also indicated that it was reasonable for markets to anticipate two or three rate cuts this year. While refraining from explicitly endorsing the market curve, he acknowledged: "I'm not going to endorse the market curve, but I think that it's reasonable that markets are taking that view, given the way inflation has performed."

Ahead of the BoE gathering, analysts at TD Securities argued: “The BoE will likely stand pat at its May meeting, as wage and inflation data is a bit too sticky to warrant a cut just yet. We see a repeat in language and another 8-1 vote, though the risks are marginally skewed to another dovish dissenter joining Dhingra. We also do not look for any major changes to the projections, though the Year 2 inflation forecast could be lower.”

In the same vein, strategists at Danske Bank noted: “We expect the Bank of England (BoE) to keep the bank rate unchanged at 5.25% on May 9, which is in line with consensus and current market pricing. Overall, we expect the MPC to soften its communication, priming the markets for an imminent start to a cutting cycle. We expect the first 25 bps cut in June.”

How will the BoE interest rate decision impact GBP/USD?

Despite inflation continuing to trend lower in March, the central bank is unlikely to change its tone to a more relaxed one and hence give a more solid signal towards the potential timing of the interest rate reduction. While surprises have been practically ruled out, the British Pound is seen maintaining its current familiar range for the time being.

Under such circumstances, GBP/USD needs to convincingly clear the critical 200-day Simple Moving Average (SMA) at 1.2545 to allow for the continuation of the ongoing recovery, which started around yearly lows in the 1.2300 neighbourhood recorded on April 22. FXStreet Senior Analyst Pablo Piovano suggests:, "Further gains may lead Cable to revisit the May peak of 1.2634 (May 3), an area that appears to be reinforced by the provisional 100-day SMA at 1.2640. Further up comes the 2024 top of 1.2893 (March 8). Surpassing this level could propel GBP/USD towards the psychological milestone of 1.3000 in the first instance.”

On the flip side, Pablo highlights that "the resurgence of the selling bias could prompt some corrective moves in the short-term horizon.  That said, an immediate contention aligns at the 2024 bottom of 1.2299 (April 22). The breach of this region exposes further weakness, although the next support is not expected to emerge until the October 2023 low of 1.2037 (October 4).

Economic Indicator

BoE Interest Rate Decision

The Bank of England (BoE) announces its interest rate decision at the end of its eight scheduled meetings per year. If the BoE is hawkish about the inflationary outlook of the economy and raises interest rates it is usually bullish for the Pound Sterling (GBP). Likewise, if the BoE adopts a dovish view on the UK economy and keeps interest rates unchanged, or cuts them, it is seen as bearish for GBP.

Read more.

Last release: Thu Mar 21, 2024 12:00

Frequency: Irregular

Actual: 5.25%

Consensus: 5.25%

Previous: 5.25%

Source: Bank of England

BoE FAQs

The Bank of England (BoE) decides monetary policy for the United Kingdom. Its primary goal is to achieve ‘price stability’, or a steady inflation rate of 2%. Its tool for achieving this is via the adjustment of base lending rates. The BoE sets the rate at which it lends to commercial banks and banks lend to each other, determining the level of interest rates in the economy overall. This also impacts the value of the Pound Sterling (GBP).

When inflation is above the Bank of England’s target it responds by raising interest rates, making it more expensive for people and businesses to access credit. This is positive for the Pound Sterling because higher interest rates make the UK a more attractive place for global investors to park their money. When inflation falls below target, it is a sign economic growth is slowing, and the BoE will consider lowering interest rates to cheapen credit in the hope businesses will borrow to invest in growth-generating projects – a negative for the Pound Sterling.

In extreme situations, the Bank of England can enact a policy called Quantitative Easing (QE). QE is the process by which the BoE substantially increases the flow of credit in a stuck financial system. QE is a last resort policy when lowering interest rates will not achieve the necessary result. The process of QE involves the BoE printing money to buy assets – usually government or AAA-rated corporate bonds – from banks and other financial institutions. QE usually results in a weaker Pound Sterling.

Quantitative tightening (QT) is the reverse of QE, enacted when the economy is strengthening and inflation starts rising. Whilst in QE the Bank of England (BoE) purchases government and corporate bonds from financial institutions to encourage them to lend; in QT, the BoE stops buying more bonds, and stops reinvesting the principal maturing on the bonds it already holds. It is usually positive for the Pound Sterling.


Disclaimer: For information purposes only. Past performance is not indicative of future results.
placeholder
U.S. November Nonfarm Payrolls: What Does the Rare "Weak Jobs, Strong Economy" Mix Mean for U.S. Equities?1. IntroductionAfter retreating from the late-October highs, U.S. equities embarked on a bottoming rebound in mid-to-late November, a trend driven by the interplay of multiple factors. That said, it i
Author  TradingKey
11 hours ago
1. IntroductionAfter retreating from the late-October highs, U.S. equities embarked on a bottoming rebound in mid-to-late November, a trend driven by the interplay of multiple factors. That said, it i
placeholder
Senate Delays Crypto Market Structure Hearings to Early 2026The Senate Banking Committee has postponed cryptocurrency market structure hearings until 2026, citing ongoing bipartisan negotiations.
Author  Mitrade
16 hours ago
The Senate Banking Committee has postponed cryptocurrency market structure hearings until 2026, citing ongoing bipartisan negotiations.
placeholder
Bitcoin Slides 5% as Sellers Lean In — Can BTC Reclaim $88,000?Bitcoin has dropped back below $88,000 after rolling over from $90,500, with price still trading under the 100-hour Simple Moving Average. The sell-off found a floor at $85,151, and BTC is now consolidating near that base, but rebounds are facing pressure from a bearish trend line around $89,000. Bulls need to retake $88,000–$89,000 to ease downside risk; failure to do so keeps $85,500–$85,000 and then $83,500 in play, with $80,000 as the deeper “line in the sand.” Bitcoin (BTC) is back in damage-control mode after a sharp pullback wiped out recent gains. The price failed to reclaim the $90,000–$90,500 band, rolled over, and slid through $88,500 before briefly dipping under $87,000. Buyers did show up around $85,000, but the rebound so far looks more like stabilization than a clear trend reversal. Bitcoin dips hard, finds a bid near $85,000(h3) BTC’s latest move lower began when it couldn’t build follow-through above $90,000 and $90,500. Once that upside stalled, sellers took control and pushed price down through $88,500. The slide accelerated enough to spike below $87,000, but the market didn’t free-fall. Bulls defended the $85,000 zone, printing a low at $85,151. Since then, Bitcoin has been consolidating below the 23.6% Fibonacci retracement of the drop from the $93,560 swing high to the $85,151 low — a clue that the bounce is still shallow and that sellers haven’t fully backed off yet. Structurally, BTC is still on the back foot: It’s trading below $88,000, and It remains below the 100-hour Simple Moving Average, keeping short-term trend pressure pointed downward. Resistance is layered, and $89,000 is the problem area(h3) If bulls try to turn this into a recovery, they’ll have to climb through multiple ceilings in quick succession. First, BTC faces resistance around $87,150, followed by a more meaningful barrier near $87,500. From there, the market’s attention snaps back to $88,000 — the level BTC just lost and now needs to reclaim. A close back above $88,000 would improve the tone, but it doesn’t solve the bigger issue: there’s a bearish trend line on the hourly BTC/USD chart (Kraken feed) with resistance near $89,000, which also lines up with the next technical hurdle. If BTC can push through $89,000 and hold, the rebound could extend toward $90,000, with follow-through targets at $91,000 and $91,500. But until price clears that $88,000–$89,000 zone, rallies are at risk of being sold rather than chased. If BTC fails to reclaim resistance, the downside path is clear(h3) The near-term bear case is simple: if Bitcoin can’t climb back above the $87,000 area and keep traction, sellers may attempt another leg lower. Support levels line up like this: Immediate support: $85,500 First major support: $85,000 Next support: $83,500 Then $82,500 in the near term Below that, the major “don’t break this” level is still $80,000. If BTC slips under $80,000, the risk of acceleration to the downside increases significantly — not because it’s magic, but because it’s the kind of psychological and structural level that tends to trigger forced de-risking. Indicators: momentum still leans bearish(h3) The intraday indicators aren’t offering much comfort yet: Hourly MACD is losing pace in the bearish zone. Hourly RSI remains below 50, suggesting sellers still have the upper hand on short timeframes. So while the $85,000 defense held for now, the market hasn’t flipped bullish — it’s just stopped bleeding.
Author  Mitrade
19 hours ago
Bitcoin has dropped back below $88,000 after rolling over from $90,500, with price still trading under the 100-hour Simple Moving Average. The sell-off found a floor at $85,151, and BTC is now consolidating near that base, but rebounds are facing pressure from a bearish trend line around $89,000. Bulls need to retake $88,000–$89,000 to ease downside risk; failure to do so keeps $85,500–$85,000 and then $83,500 in play, with $80,000 as the deeper “line in the sand.” Bitcoin (BTC) is back in damage-control mode after a sharp pullback wiped out recent gains. The price failed to reclaim the $90,000–$90,500 band, rolled over, and slid through $88,500 before briefly dipping under $87,000. Buyers did show up around $85,000, but the rebound so far looks more like stabilization than a clear trend reversal. Bitcoin dips hard, finds a bid near $85,000(h3) BTC’s latest move lower began when it couldn’t build follow-through above $90,000 and $90,500. Once that upside stalled, sellers took control and pushed price down through $88,500. The slide accelerated enough to spike below $87,000, but the market didn’t free-fall. Bulls defended the $85,000 zone, printing a low at $85,151. Since then, Bitcoin has been consolidating below the 23.6% Fibonacci retracement of the drop from the $93,560 swing high to the $85,151 low — a clue that the bounce is still shallow and that sellers haven’t fully backed off yet. Structurally, BTC is still on the back foot: It’s trading below $88,000, and It remains below the 100-hour Simple Moving Average, keeping short-term trend pressure pointed downward. Resistance is layered, and $89,000 is the problem area(h3) If bulls try to turn this into a recovery, they’ll have to climb through multiple ceilings in quick succession. First, BTC faces resistance around $87,150, followed by a more meaningful barrier near $87,500. From there, the market’s attention snaps back to $88,000 — the level BTC just lost and now needs to reclaim. A close back above $88,000 would improve the tone, but it doesn’t solve the bigger issue: there’s a bearish trend line on the hourly BTC/USD chart (Kraken feed) with resistance near $89,000, which also lines up with the next technical hurdle. If BTC can push through $89,000 and hold, the rebound could extend toward $90,000, with follow-through targets at $91,000 and $91,500. But until price clears that $88,000–$89,000 zone, rallies are at risk of being sold rather than chased. If BTC fails to reclaim resistance, the downside path is clear(h3) The near-term bear case is simple: if Bitcoin can’t climb back above the $87,000 area and keep traction, sellers may attempt another leg lower. Support levels line up like this: Immediate support: $85,500 First major support: $85,000 Next support: $83,500 Then $82,500 in the near term Below that, the major “don’t break this” level is still $80,000. If BTC slips under $80,000, the risk of acceleration to the downside increases significantly — not because it’s magic, but because it’s the kind of psychological and structural level that tends to trigger forced de-risking. Indicators: momentum still leans bearish(h3) The intraday indicators aren’t offering much comfort yet: Hourly MACD is losing pace in the bearish zone. Hourly RSI remains below 50, suggesting sellers still have the upper hand on short timeframes. So while the $85,000 defense held for now, the market hasn’t flipped bullish — it’s just stopped bleeding.
placeholder
AUD/USD remains depressed below mid-0.6600s; downside seems limited ahead of US NFP reportThe AUD/USD pair attracts some sellers for the fourth straight day on Tuesday and trades around the 0.6630 region, down just over 0.10%, during the Asian session.
Author  FXStreet
20 hours ago
The AUD/USD pair attracts some sellers for the fourth straight day on Tuesday and trades around the 0.6630 region, down just over 0.10%, during the Asian session.
placeholder
Macro Analysts: Hawkish Japan Could Push Bitcoin Below $70KAnalysts predict Bitcoin may face further declines towards the $70,000 mark if the Bank of Japan raises interest rates as expected.
Author  Mitrade
Yesterday 05: 48
Analysts predict Bitcoin may face further declines towards the $70,000 mark if the Bank of Japan raises interest rates as expected.
goTop
quote